\n
## Scatter Plot: Security Studies Confidence vs. Target Length
### Overview
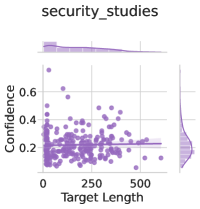
The image presents a scatter plot visualizing the relationship between "Target Length" and "Confidence" for "security_studies". The plot displays a large number of data points, along with a regression line attempting to model the trend. There are also density plots along the top and right edges of the chart.
### Components/Axes
* **Title:** "security\_studies" (top-center)
* **X-axis:** "Target Length" (bottom-center), ranging from approximately 0 to 600.
* **Y-axis:** "Confidence" (left-center), ranging from approximately 0.1 to 0.65.
* **Data Points:** Numerous purple dots scattered across the plot.
* **Regression Line:** A purple line attempting to fit the trend of the data points.
* **Density Plot (Top):** A purple shaded area representing the distribution of "Target Length".
* **Density Plot (Right):** A purple shaded area representing the distribution of "Confidence".
### Detailed Analysis
The scatter plot shows a generally negative correlation between "Target Length" and "Confidence". As "Target Length" increases, "Confidence" tends to decrease. However, the relationship is not strong, and there is significant scatter in the data.
* **Regression Line Trend:** The regression line slopes downward, confirming the negative correlation.
* **Data Point Distribution:**
* For "Target Length" values between 0 and 250, "Confidence" values are generally higher, ranging from approximately 0.2 to 0.6.
* As "Target Length" increases beyond 250, "Confidence" values tend to cluster around 0.15 to 0.3.
* There are a few outliers with high "Confidence" values (above 0.5) even at higher "Target Length" values.
* **Density Plot (Top):** The density plot shows a peak in the distribution of "Target Length" around 0-100, and a gradual decline as "Target Length" increases.
* **Density Plot (Right):** The density plot shows a peak in the distribution of "Confidence" around 0.2-0.3, with a tail extending towards lower confidence values.
### Key Observations
* The negative correlation between "Target Length" and "Confidence" suggests that longer targets are associated with lower confidence.
* The significant scatter in the data indicates that "Target Length" is not the sole determinant of "Confidence". Other factors likely play a role.
* The density plots confirm the general trends observed in the scatter plot.
### Interpretation
The data suggests that the confidence in security studies decreases as the length of the target increases. This could be due to several reasons: longer targets may be more complex and difficult to analyze, or they may be more vulnerable to attack. The scatter in the data indicates that there is considerable variability in confidence levels, even for targets of the same length. This suggests that other factors, such as the specific characteristics of the target or the expertise of the analyst, also play a role. The density plots provide further insight into the distribution of target lengths and confidence levels, highlighting the most common values and the range of variability. The presence of outliers suggests that there are some cases where confidence is unexpectedly high or low, which may warrant further investigation.