## Diagram: Experimental Setup with Angular and Spatial Measurements
### Overview
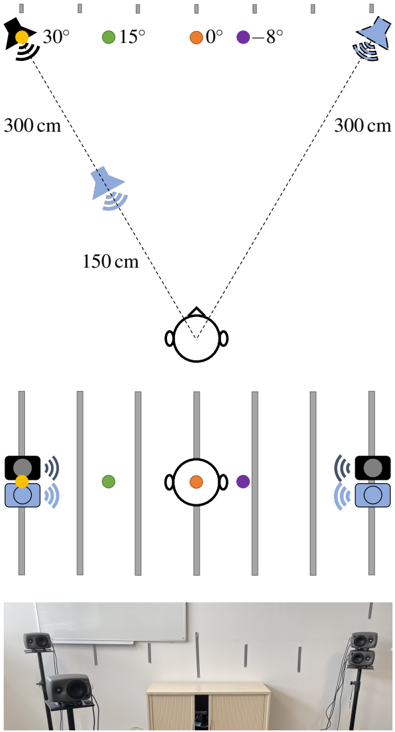
The image depicts a technical experimental setup involving angular positioning, spatial measurements, and device placement. It includes a schematic diagram, a legend, and a real-world photograph of the setup. The diagram uses color-coded markers to represent angular positions relative to a central observer, while the schematic and photograph illustrate device placement and spatial relationships.
---
### Components/Axes
#### Diagram Elements:
1. **Central Observer**: A stylized human head-and-shoulders icon at the bottom center.
2. **Angular Markers**:
- **30° (Yellow)**: Leftmost marker, 300 cm from the observer.
- **15° (Green)**: Midway marker, 150 cm from the observer.
- **0° (Orange)**: Central marker, aligned with the observer.
- **-8° (Purple)**: Rightmost marker, 300 cm from the observer.
3. **Distance Labels**:
- "300 cm" on both outer lines (left and right).
- "150 cm" on the left inner line.
4. **Legend**: Located at the top-left, associating colors with angles:
- Yellow = 30°, Green = 15°, Orange = 0°, Purple = -8°.
#### Schematic Elements:
1. **Vertical Partitions**: Five gray vertical lines representing spatial divisions.
2. **Devices**:
- **Left Device**: Speaker (blue) and camera (black) on a stand, emitting sound waves.
- **Right Device**: Speaker (blue) and camera (black) on a stand, emitting sound waves.
3. **Colored Dots**:
- Green dot near the left device (15°).
- Orange dot at the center (0°).
- Purple dot near the right device (-8°).
#### Photograph Elements:
1. **Real-World Setup**:
- Two speaker-camera setups on black stands (left and right).
- A light-colored cabinet centered between the devices.
- A whiteboard mounted on the wall behind the cabinet.
---
### Detailed Analysis
#### Diagram:
- **Angular Distribution**:
- The observer’s field of view spans from -8° to 30°, with markers at 15° and 0°.
- Distances decrease from 300 cm (outer markers) to 150 cm (inner left marker).
- **Color-Space Correlation**:
- Yellow (30°) and Purple (-8°) are at the farthest distances (300 cm).
- Green (15°) and Orange (0°) are closer (150 cm and 0 cm, respectively).
#### Schematic:
- **Device Placement**:
- Left device aligns with the 15° (green) marker.
- Right device aligns with the -8° (purple) marker.
- Central observer (orange) is positioned between devices.
#### Photograph:
- **Spatial Relationships**:
- Speaker-camera setups mirror the schematic’s left/right devices.
- Cabinet acts as a central reference point (0° marker).
- Whiteboard provides a neutral background for calibration.
---
### Key Observations
1. **Symmetry**: The setup is symmetrical along the central axis (0°), with devices equidistant from the observer.
2. **Angular Precision**: The -8° marker suggests sub-degree angular resolution.
3. **Distance Gradient**: Distances decrease from 300 cm (outer) to 150 cm (inner), possibly to test proximity effects.
4. **Device Functionality**: Speakers emit sound, while cameras likely record positional data or subject responses.
---
### Interpretation
This setup appears to study **spatial perception** or **auditory localization** from a central observer’s perspective. The angular markers (30°, 15°, 0°, -8°) and distances (300 cm, 150 cm) suggest controlled experiments to measure how stimuli at specific angles and ranges are perceived. The real-world photograph confirms the schematic’s layout, with the cabinet serving as a neutral reference. The use of color-coded markers ensures precise tracking of positional data. The -8° marker indicates a focus on subtle angular variations, possibly to test edge-case perception. The devices’ placement implies a bidirectional stimulus-response model, where sound emission and visual tracking are synchronized.