## Scatter Plot with Regression Lines: Model Size vs Average Reasoning and Capability Accuracy
### Overview
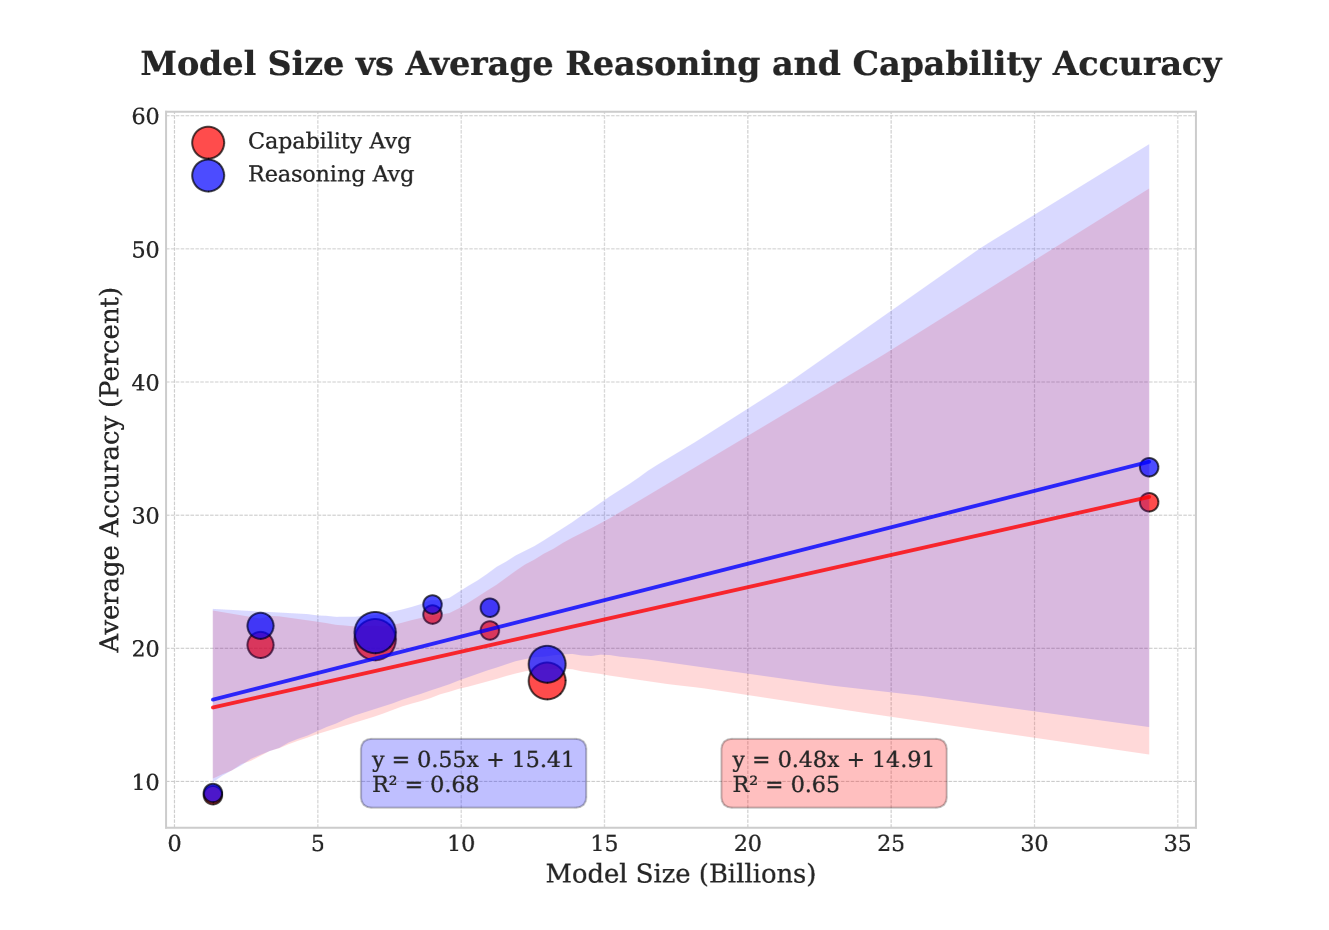
The image is a scatter plot with two overlaid linear regression trend lines and their associated confidence intervals. It visualizes the relationship between the size of a model (in billions of parameters) and its average accuracy (in percent) on two distinct metrics: "Capability Avg" and "Reasoning Avg." The chart suggests a positive correlation between model size and performance for both metrics.
### Components/Axes
* **Title:** "Model Size vs Average Reasoning and Capability Accuracy"
* **X-Axis:** Label: "Model Size (Billions)". Scale: Linear, from 0 to 35, with major ticks every 5 units.
* **Y-Axis:** Label: "Average Accuracy (Percent)". Scale: Linear, from 0 to 60, with major ticks every 10 units.
* **Legend:** Located in the top-left corner of the plot area.
* Red circle: "Capability Avg"
* Blue circle: "Reasoning Avg"
* **Data Series & Trend Lines:**
* **Reasoning Avg (Blue):** Represented by blue circles and a solid blue trend line. A blue shaded region represents its confidence interval. A blue text box contains its regression equation: `y = 0.55x + 15.41` and coefficient of determination: `R² = 0.68`.
* **Capability Avg (Red):** Represented by red circles and a solid red trend line. A red shaded region represents its confidence interval. A red text box contains its regression equation: `y = 0.48x + 14.91` and coefficient of determination: `R² = 0.65`.
### Detailed Analysis
**Data Points (Approximate Coordinates):**
* **Reasoning Avg (Blue Circles):**
* (1, 9)
* (3, 22)
* (7, 21)
* (9, 23)
* (11, 23)
* (13, 19)
* (34, 34)
* **Capability Avg (Red Circles):**
* (3, 20)
* (7, 21)
* (9, 23)
* (11, 21)
* (13, 18)
* (34, 31)
**Trend Line Analysis:**
* **Reasoning Avg (Blue Line):** The line slopes upward from left to right, indicating a positive linear relationship. It starts at approximately y=16 when x=0 and rises to approximately y=34 at x=34. The slope (0.55) is steeper than the Capability Avg line.
* **Capability Avg (Red Line):** Also slopes upward, indicating a positive linear relationship. It starts at approximately y=15 when x=0 and rises to approximately y=31 at x=34. The slope (0.48) is shallower than the Reasoning Avg line.
**Confidence Intervals:**
* Both trend lines are surrounded by shaded regions (light blue for Reasoning, light red for Capability) that widen as model size increases. This indicates greater uncertainty in the predicted accuracy for larger models. The blue (Reasoning) confidence interval is notably wider than the red (Capability) interval, especially at larger model sizes.
### Key Observations
1. **Positive Correlation:** Both "Reasoning Avg" and "Capability Avg" show a clear positive correlation with model size. Larger models tend to have higher average accuracy.
2. **Diverging Slopes:** The "Reasoning Avg" metric improves at a slightly faster rate per billion parameters (slope = 0.55) compared to "Capability Avg" (slope = 0.48).
3. **Model Fit:** The regression models explain a moderate amount of variance, with R² values of 0.68 for Reasoning and 0.65 for Capability.
4. **Outlier/Potential Threshold:** The smallest model plotted (approx. 1B parameters) has a very low "Reasoning Avg" score (~9%), which is a significant outlier below the trend line. This suggests a potential performance cliff or threshold for reasoning capabilities at very small model sizes.
5. **Convergence at Mid-Range:** Between model sizes of approximately 7B and 13B, the data points for both metrics are tightly clustered and often overlap, indicating similar performance levels in this range.
6. **Uncertainty Growth:** The widening confidence intervals suggest that while the trend is positive, the specific accuracy of a very large model (e.g., 35B+) is less predictable based on this data.
### Interpretation
The data demonstrates that scaling model size is a viable strategy for improving both general capabilities and reasoning skills in AI models. The steeper slope for "Reasoning Avg" suggests that reasoning abilities may benefit more from increased scale than other capabilities, or that they emerge more prominently as models grow larger.
The overlapping data points and confidence intervals in the 7B-13B range imply that for mid-sized models, the distinction between "reasoning" and "capability" performance may be minimal. However, the divergence of the trend lines and the outlier at the smallest size hint that reasoning might be a more complex capability that requires a certain scale to develop reliably.
The increasing uncertainty (wider confidence bands) for larger models is a critical insight. It indicates that while the average trend is upward, individual large models may exhibit high variance in performance. This could be due to factors not captured by size alone, such as training data quality, architecture, or optimization. Therefore, while scaling is promising, it does not guarantee a specific accuracy outcome, and other factors become increasingly important for predicting performance at the large end of the scale.