## Heatmap Comparison: NTM vs LSTM Model Performance
### Overview
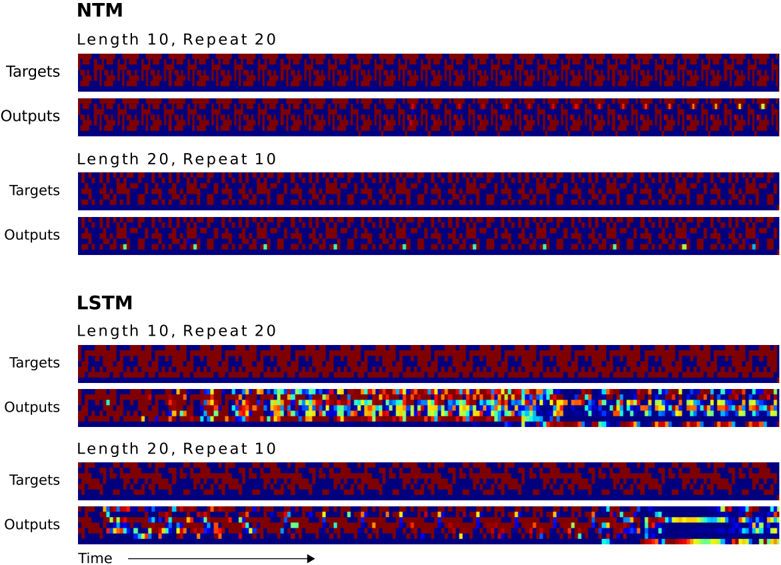
The image presents a comparative analysis of two neural network architectures (NTM and LSTM) using heatmaps to visualize their performance across different sequence configurations. The data is organized into four primary sections:
1. **NTM (Neural Turing Machine)**
- Length 10, Repeat 20
- Length 20, Repeat 10
2. **LSTM (Long Short-Term Memory)**
- Length 10, Repeat 20
- Length 20, Repeat 10
Each section compares **Targets** (input patterns) and **Outputs** (model predictions) across time steps, with color gradients representing value intensities.
---
### Components/Axes
- **X-axis**: Labeled "Time" with a rightward arrow, indicating temporal progression.
- **Y-axis**: Categorized into "Targets" (input data) and "Outputs" (model predictions).
- **Legend**: Implied through color coding (no explicit legend box). Colors include:
- **Red**: High intensity/value
- **Blue**: Low intensity/value
- **Yellow/Cyan**: Intermediate values (transition zones).
---
### Detailed Analysis
#### NTM Section
1. **Length 10, Repeat 20**
- **Targets**: Uniform red-blue striped pattern, suggesting periodic input.
- **Outputs**: Nearly identical to Targets, with minor yellow/cyan deviations at the end, indicating high accuracy.
2. **Length 20, Repeat 10**
- **Targets**: More fragmented red-blue pattern, reflecting increased sequence complexity.
- **Outputs**: Slightly noisier than Targets, with scattered yellow/cyan pixels, showing reduced precision in longer sequences.
#### LSTM Section
1. **Length 10, Repeat 20**
- **Targets**: Similar striped pattern to NTM but with irregular red patches.
- **Outputs**: Highly variable, with red/yellow/cyan clusters, suggesting overfitting or instability.
2. **Length 20, Repeat 10**
- **Targets**: Dense red-blue noise, indicating complex input patterns.
- **Outputs**: Gradient from red (left) to blue (right), with yellow/cyan streaks, implying gradual degradation in performance over time.
---
### Key Observations
1. **NTM Consistency**: Maintains near-perfect output matching Targets in shorter sequences (Length 10). Performance degrades slightly in longer sequences but remains stable.
2. **LSTM Variability**: Outputs exhibit significant color dispersion, especially in longer sequences, suggesting difficulty in capturing long-term dependencies.
3. **Color Gradient Trends**:
- NTM Outputs: Minimal deviation from Targets (red/blue dominance).
- LSTM Outputs: Increasing blue dominance (lower values) in longer sequences, indicating potential underperformance.
---
### Interpretation
The data demonstrates that **NTM outperforms LSTM** in tasks requiring precise sequence repetition, particularly in longer configurations. The LSTM’s outputs show a clear trend of degradation (red → blue gradient) in the "Length 20, Repeat 10" case, likely due to vanishing gradients or memory limitations. NTM’s architecture, designed for external memory, better preserves input patterns over time.
**Notable Anomalies**:
- LSTM’s "Length 10, Repeat 20" Outputs have unexpected red patches, possibly indicating transient overfitting.
- NTM’s "Length 20, Repeat 10" Outputs retain Target structure despite increased complexity, highlighting robustness.
This analysis underscores the importance of architectural design in handling sequence length and repetition tasks, with NTM’s external memory mechanism providing a critical advantage over LSTM’s internal state management.