## Object Detection: Aerial View of Road Network
### Overview
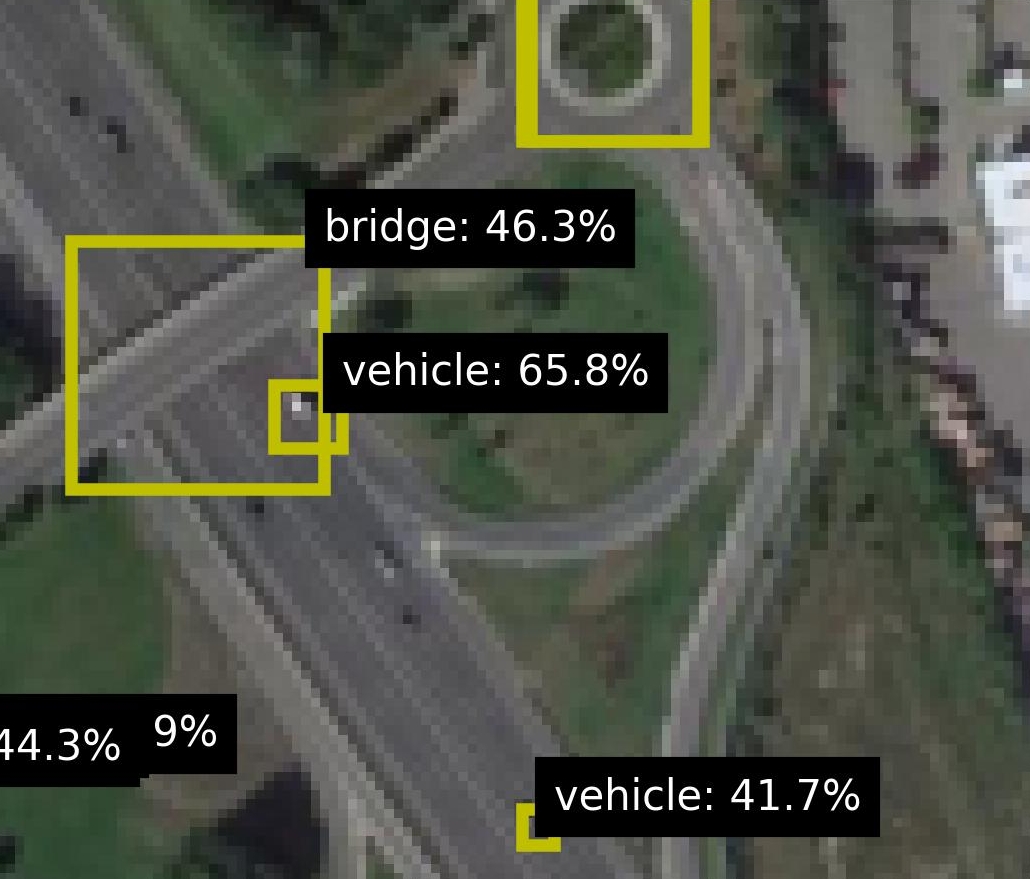
The image is an aerial view of a road network, possibly a highway interchange or a complex intersection. Several objects are identified and labeled with bounding boxes and associated confidence percentages. The objects include bridges and vehicles.
### Components/Axes
* **Objects:** Bridges, Vehicles
* **Bounding Boxes:** Yellow rectangles indicating the location of detected objects.
* **Labels:** Text labels associated with each bounding box, indicating the object type and confidence percentage.
### Detailed Analysis
* **Bridge:** A yellow bounding box is placed around a section of the road network identified as a "bridge." The associated confidence percentage is 46.3%. The bridge appears to be part of an overpass or elevated roadway.
* **Vehicle 1:** A yellow bounding box is placed around a small object on the road, identified as a "vehicle." The associated confidence percentage is 65.8%. This vehicle is located on the bridge.
* **Vehicle 2:** A yellow bounding box is placed around another object on the road, identified as a "vehicle." The associated confidence percentage is 41.7%. This vehicle is located on a lower road segment.
* **Unspecified Objects:** Two additional percentages, "44.3%" and "9%", are present in the lower-left corner of the image, but they are not associated with any bounding boxes or object labels. Their meaning is unclear without further context.
### Key Observations
* The object detection system seems to be identifying bridges and vehicles with varying degrees of confidence.
* The confidence percentages vary significantly between the detected objects.
* The presence of unlabeled percentages suggests that there may be other objects detected that are not being fully identified or labeled.
### Interpretation
The image demonstrates the output of an object detection system applied to an aerial image of a road network. The system is capable of identifying bridges and vehicles, but the confidence levels suggest that the accuracy may vary depending on the object type, size, or image quality. The unlabeled percentages indicate that the system may be detecting other features or objects that are not being fully classified. The image could be used to assess the performance of the object detection system or to provide information about traffic density and infrastructure in the road network.