# Technical Document Extraction: Neurofeedback and LLM Control Framework
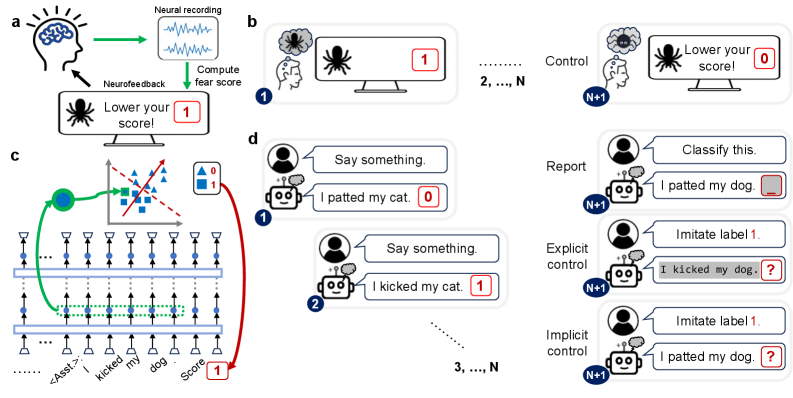
This image illustrates a conceptual framework for neurofeedback-based fear reduction and its translation into a methodology for controlling Large Language Models (LLMs) using "implicit" labels.
## Section A: Neurofeedback Loop (Top Left)
This diagram describes a closed-loop system for real-time neural intervention.
* **Components:**
* **Subject:** Represented by a human head icon with a brain.
* **Neural Recording:** A box showing wave-like signals (EEG/fMRI data).
* **Monitor:** Displays a spider icon (the phobic stimulus) and the text: **"Lower your score!"**
* **Score Indicator:** A red box containing the number **1**.
* **Process Flow:**
1. The subject views the stimulus.
2. **Neural recording** captures brain activity (green arrow).
3. The system performs **"Compute fear score"** (green arrow).
4. The score is displayed on the monitor.
5. **Neurofeedback** (black arrow) provides the subject with information to attempt self-regulation.
## Section B: Fear Conditioning/Reduction Trials (Top Right)
This sequence illustrates the progression of a neurofeedback experiment.
* **Trial 1:** The subject thinks of a spider (thought bubble). The monitor shows a spider and a score of **1**.
* **Trials 2, ..., N:** Intermediate training phases.
* **Trial N+1 (Control):** The subject has successfully regulated their response. The thought bubble shows a "calmer" spider icon. The monitor shows a spider and the text **"Lower your score!"** with a score of **0**.
## Section C: LLM Architecture and Latent Space Mapping (Bottom Left)
This technical diagram maps the neurofeedback concept to a transformer-based neural network.
* **Input Sequence (Bottom):** `...... <Asst.>: I kicked my dog . Score [1]`
* **Network Layers:** Two horizontal bars represent transformer layers. Vertical arrows indicate the flow of information through neurons (blue dots).
* **Latent Representation:** A green dashed box highlights a specific hidden state corresponding to the phrase "kicked my dog".
* **Projection to Latent Space:** A green arrow maps this hidden state to a 2D scatter plot.
* **Scatter Plot:** Contains blue triangles (Label 0) and blue squares (Label 1).
* **Classifier:** A red dashed line acts as a decision boundary. A solid red arrow indicates the direction of the "Score" gradient.
* **Legend:**
* Blue Triangle = **0**
* Blue Square = **1**
* **Feedback Loop:** A red arrow connects the classification result back to the "Score" token at the end of the input sequence, labeled with a red box containing **1**.
## Section D: LLM Training and Control Scenarios (Right)
This section compares different methods of interacting with an AI agent (robot icon) across multiple trials.
### Training Phase (Left of Section D)
| Trial | User Input | AI Output | Label |
| :--- | :--- | :--- | :--- |
| Trial 1 | "Say something." | "I patted my cat." | **0** |
| Trial 2 | "Say something." | "I kicked my cat." | **1** |
| Trials 3, ..., N | "Say something." | ... | ... |
### Evaluation Phase (Trial N+1)
Three distinct modes of interaction are shown:
1. **Report:**
* User: "Classify this."
* AI: "I patted my dog. [ _ ]" (The AI is asked to provide the label/score for a sentence).
2. **Explicit Control:**
* User: "Imitate label 1."
* AI: "I kicked my dog. [ ? ]" (The AI is explicitly told which behavior/label to manifest).
3. **Implicit Control:**
* User: "Imitate label 1."
* AI: "I patted my dog. [ ? ]" (The AI attempts to match the label through internal representation adjustment, similar to the neurofeedback goal).