TECHNICAL ASSET FINGERPRINT
189ee833318ecb4fd61840c8
Click to view fullscreen
Press ESC or click to close
FOUND IN PAPERS
EXPERT: gemini-2.5-flash-free VERSION 1
RUNTIME: google-free/gemini-2.5-flash
INTEL_VERIFIED
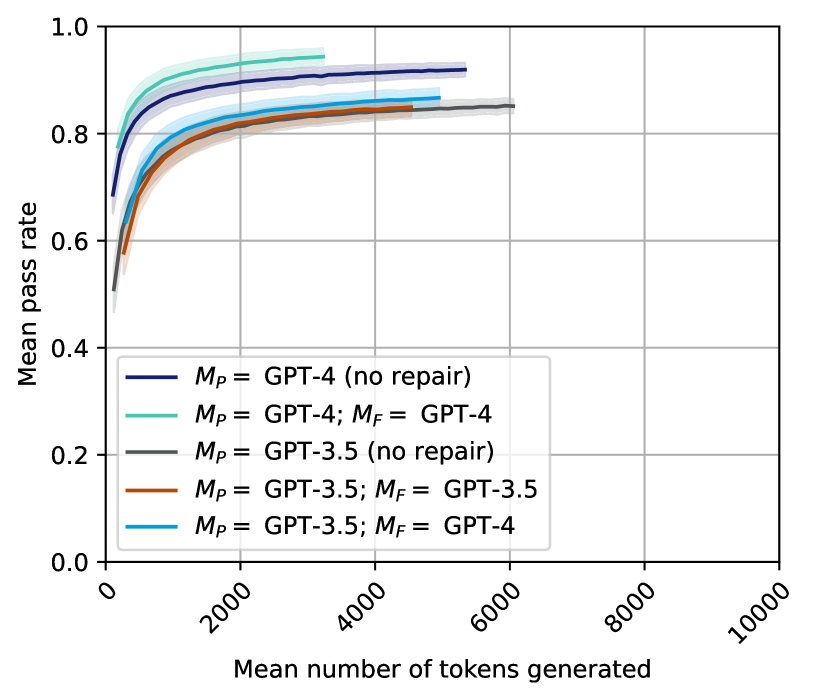
## Chart Type: Line Chart - Mean Pass Rate vs. Mean Number of Tokens Generated
### Overview
This image displays a line chart illustrating the relationship between the "Mean number of tokens generated" on the x-axis and the "Mean pass rate" on the y-axis. Five different configurations of language models (GPT-4 and GPT-3.5) and repair strategies (`M_P` for primary model, `M_F` for repair model) are plotted as distinct lines, each with a shaded area representing uncertainty or a confidence interval. The chart demonstrates how the pass rate changes as more tokens are generated, comparing the performance of different models and the impact of a repair mechanism.
### Components/Axes
The chart is structured with a main plotting area, an x-axis at the bottom, a y-axis on the left, and a legend in the bottom-left quadrant of the plot.
* **X-axis Label**: "Mean number of tokens generated"
* **Range**: From 0 to 10000.
* **Major Tick Markers**: 0, 2000, 4000, 6000, 8000, 10000. The tick labels are rotated approximately 45 degrees counter-clockwise.
* **Y-axis Label**: "Mean pass rate"
* **Range**: From 0.0 to 1.0.
* **Major Tick Markers**: 0.0, 0.2, 0.4, 0.6, 0.8, 1.0.
* **Grid**: Light gray grid lines are present at each major tick mark for both the x and y axes, extending across the entire plot area.
* **Legend**: Located in the bottom-left area of the plot, above the x-axis. It lists five data series with their corresponding line colors and labels:
* **Dark Blue line with light blue-purple shaded area**: `M_P = GPT-4 (no repair)`
* **Teal/Light Blue-Green line with matching shaded area**: `M_P = GPT-4; M_F = GPT-4`
* **Dark Gray line with light gray shaded area**: `M_P = GPT-3.5 (no repair)`
* **Brown/Orange line with matching shaded area**: `M_P = GPT-3.5; M_F = GPT-3.5`
* **Cyan/Bright Blue line with matching shaded area**: `M_P = GPT-3.5; M_F = GPT-4`
### Detailed Analysis
All lines generally exhibit a rapid increase in "Mean pass rate" at lower "Mean number of tokens generated," followed by a plateau where the pass rate stabilizes or increases only marginally with more tokens. The shaded areas around each line represent a confidence interval or uncertainty, which appears relatively narrow for all series.
1. **Dark Blue line: `M_P = GPT-4 (no repair)`**
* **Trend**: This line starts at approximately 0.68 pass rate for very few tokens, rises steeply, and then flattens out around a pass rate of 0.92-0.93. It extends up to approximately 3500 tokens.
* **Approximate Data Points**:
* ~0 tokens: ~0.68 pass rate
* ~500 tokens: ~0.80 pass rate
* ~1000 tokens: ~0.86 pass rate
* ~2000 tokens: ~0.90 pass rate
* ~3000 tokens: ~0.92 pass rate
* ~3500 tokens: ~0.925 pass rate (endpoint)
2. **Teal/Light Blue-Green line: `M_P = GPT-4; M_F = GPT-4`**
* **Trend**: This line starts at approximately 0.68 pass rate, shows a steep initial rise, and then plateaus at the highest pass rate among all series, around 0.93-0.94. It extends the furthest, up to approximately 5500 tokens.
* **Approximate Data Points**:
* ~0 tokens: ~0.68 pass rate
* ~500 tokens: ~0.82 pass rate
* ~1000 tokens: ~0.88 pass rate
* ~2000 tokens: ~0.91 pass rate
* ~3000 tokens: ~0.925 pass rate
* ~4000 tokens: ~0.93 pass rate
* ~5000 tokens: ~0.935 pass rate
* ~5500 tokens: ~0.935 pass rate (endpoint)
3. **Dark Gray line: `M_P = GPT-3.5 (no repair)`**
* **Trend**: This line starts at the lowest initial pass rate, around 0.50, rises steeply but less rapidly than the GPT-4 lines, and then plateaus around 0.84-0.85. It extends up to approximately 6000 tokens.
* **Approximate Data Points**:
* ~0 tokens: ~0.50 pass rate
* ~500 tokens: ~0.70 pass rate
* ~1000 tokens: ~0.76 pass rate
* ~2000 tokens: ~0.80 pass rate
* ~3000 tokens: ~0.82 pass rate
* ~4000 tokens: ~0.83 pass rate
* ~5000 tokens: ~0.84 pass rate
* ~6000 tokens: ~0.845 pass rate (endpoint)
4. **Brown/Orange line: `M_P = GPT-3.5; M_F = GPT-3.5`**
* **Trend**: This line starts at approximately 0.58 pass rate, rises steeply, and then plateaus around 0.85-0.86. It extends up to approximately 5500 tokens.
* **Approximate Data Points**:
* ~0 tokens: ~0.58 pass rate
* ~500 tokens: ~0.75 pass rate
* ~1000 tokens: ~0.80 pass rate
* ~2000 tokens: ~0.83 pass rate
* ~3000 tokens: ~0.84 pass rate
* ~4000 tokens: ~0.85 pass rate
* ~5000 tokens: ~0.855 pass rate
* ~5500 tokens: ~0.86 pass rate (endpoint)
5. **Cyan/Bright Blue line: `M_P = GPT-3.5; M_F = GPT-4`**
* **Trend**: This line starts at approximately 0.60 pass rate, rises steeply, and then plateaus around 0.87-0.88. It extends up to approximately 5500 tokens.
* **Approximate Data Points**:
* ~0 tokens: ~0.60 pass rate
* ~500 tokens: ~0.78 pass rate
* ~1000 tokens: ~0.82 pass rate
* ~2000 tokens: ~0.85 pass rate
* ~3000 tokens: ~0.86 pass rate
* ~4000 tokens: ~0.87 pass rate
* ~5000 tokens: ~0.875 pass rate
* ~5500 tokens: ~0.88 pass rate (endpoint)
### Key Observations
* **GPT-4 Superiority**: Both GPT-4 configurations (dark blue and teal) consistently achieve higher mean pass rates than any GPT-3.5 configuration across all token generation levels.
* **Impact of Repair Mechanism (`M_F`)**:
* For `M_P = GPT-4`, adding `M_F = GPT-4` (teal line) results in a slightly higher peak pass rate (around 0.935-0.94) and extends the token generation range compared to `M_P = GPT-4 (no repair)` (dark blue line, peak around 0.925-0.93).
* For `M_P = GPT-3.5`, the repair mechanism significantly improves performance. `M_P = GPT-3.5; M_F = GPT-3.5` (brown/orange line) performs better than `M_P = GPT-3.5 (no repair)` (dark gray line).
* The most significant improvement for `M_P = GPT-3.5` comes from using `M_F = GPT-4` (cyan/bright blue line), which elevates its pass rate to approximately 0.87-0.88, surpassing `M_P = GPT-3.5; M_F = GPT-3.5` and approaching the performance of `M_P = GPT-4 (no repair)`.
* **Diminishing Returns**: All curves show a clear plateau, indicating that beyond approximately 3000-4000 tokens, generating more tokens yields minimal additional improvement in the mean pass rate.
* **Highest Performance**: The `M_P = GPT-4; M_F = GPT-4` configuration (teal line) achieves the highest mean pass rate and maintains it over the widest range of tokens generated.
* **Lowest Performance**: The `M_P = GPT-3.5 (no repair)` configuration (dark gray line) consistently shows the lowest mean pass rate.
### Interpretation
This chart effectively demonstrates the performance characteristics of different language models and the value of a "repair" mechanism in achieving higher task success rates.
1. **Inherent Model Capability**: GPT-4 is shown to be inherently more capable than GPT-3.5, achieving a significantly higher pass rate even without any explicit repair mechanism. The `M_P = GPT-4 (no repair)` line starts higher and plateaus at a higher pass rate than any GPT-3.5 configuration.
2. **Value of Repair**: The repair mechanism (`M_F`) generally enhances performance. For the less capable `M_P = GPT-3.5`, the repair mechanism is crucial. Using `M_F = GPT-3.5` provides a noticeable boost over no repair, but using a more powerful model for repair, `M_F = GPT-4`, with `M_P = GPT-3.5` yields a substantially better outcome. This suggests that the quality of the repair model is paramount, and a superior repair model can significantly compensate for a less powerful primary model.
3. **Optimal Token Generation**: The plateauing of all curves indicates that there's an optimal range for the "mean number of tokens generated." Beyond this range (roughly 3000-4000 tokens for most configurations), the additional computational cost of generating more tokens does not translate into a meaningful increase in the pass rate. This implies efficiency considerations for deploying these models.
4. **Synergy of Powerful Models**: The `M_P = GPT-4; M_F = GPT-4` configuration represents the most robust and highest-performing setup, achieving the highest pass rate and maintaining it across a broader range of token generation. This suggests that combining a powerful primary model with an equally powerful repair model offers the best overall performance.
In essence, the data suggests that while a more powerful base model (GPT-4) is a strong determinant of success, a well-chosen repair mechanism, especially one leveraging a more capable model, can significantly improve the performance of less powerful primary models and further enhance already strong ones. The chart provides valuable insights for optimizing model deployment strategies by balancing performance goals with computational efficiency.
DECODING INTELLIGENCE...