## Line Chart: ARC-C Accuracy vs. Training Data Percentage
### Overview
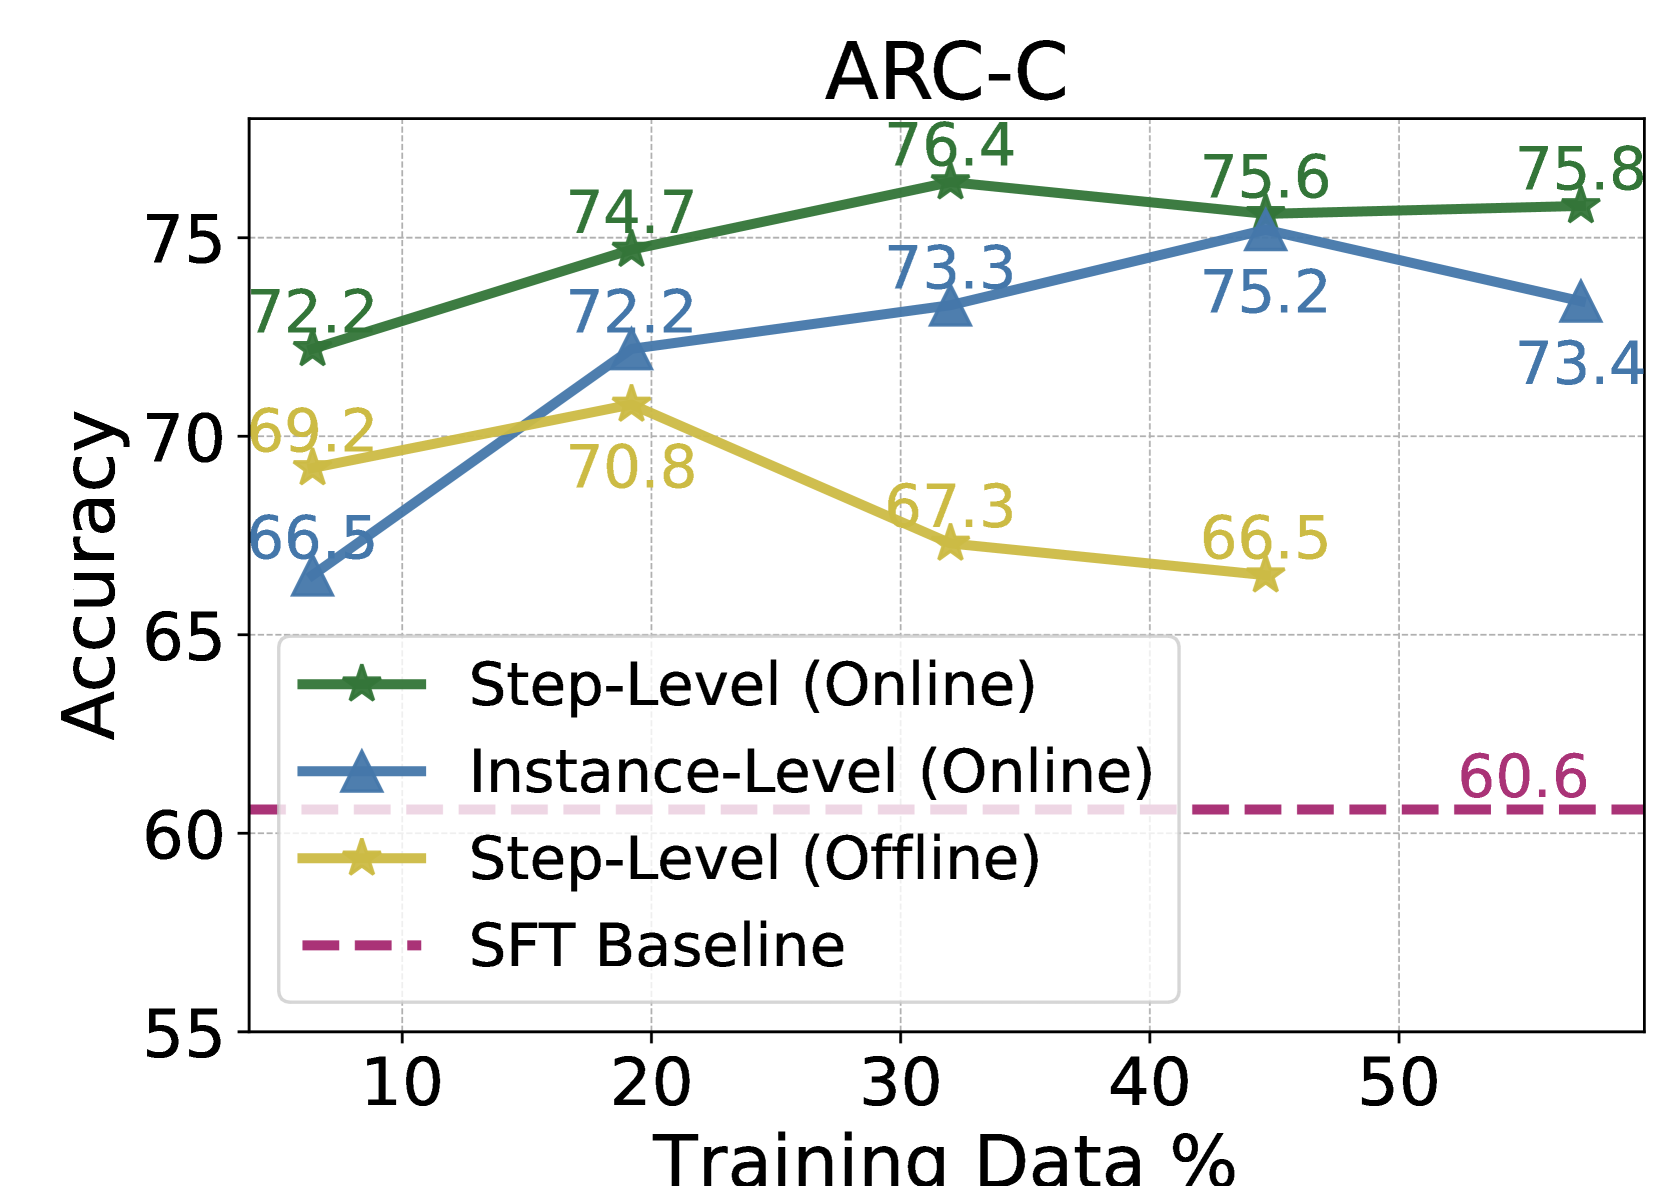
The image is a line chart titled "ARC-C" that plots the performance (Accuracy) of three different training methods and one baseline against the percentage of training data used. The chart compares "Step-Level (Online)", "Instance-Level (Online)", and "Step-Level (Offline)" methods against a fixed "SFT Baseline".
### Components/Axes
* **Title:** "ARC-C" (centered at the top).
* **Y-Axis:** Labeled "Accuracy". The scale runs from 55 to 75, with major gridlines at intervals of 5 (55, 60, 65, 70, 75).
* **X-Axis:** Labeled "Training Data %". The scale runs from approximately 5 to 55, with labeled tick marks at 10, 20, 30, 40, and 50.
* **Legend:** Located in the bottom-left quadrant of the plot area. It contains four entries:
1. **Step-Level (Online):** Represented by a solid green line with star (★) markers.
2. **Instance-Level (Online):** Represented by a solid blue line with upward-pointing triangle (▲) markers.
3. **Step-Level (Offline):** Represented by a solid yellow/gold line with star (★) markers.
4. **SFT Baseline:** Represented by a dashed pink/magenta horizontal line.
### Detailed Analysis
**Data Series and Exact Values:**
1. **Step-Level (Online) - Green Line with Stars:**
* Trend: Shows a steady upward trend from 10% to 30% training data, peaks at 30%, then slightly declines and plateaus.
* Data Points:
* At 10%: Accuracy = 72.2
* At 20%: Accuracy = 74.7
* At 30%: Accuracy = 76.4 (Peak)
* At 40%: Accuracy = 75.6
* At 50%: Accuracy = 75.8
2. **Instance-Level (Online) - Blue Line with Triangles:**
* Trend: Shows a strong upward trend from 10% to 40%, then a noticeable drop at 50%.
* Data Points:
* At 10%: Accuracy = 66.5
* At 20%: Accuracy = 72.2
* At 30%: Accuracy = 73.3
* At 40%: Accuracy = 75.2 (Peak)
* At 50%: Accuracy = 73.4
3. **Step-Level (Offline) - Yellow Line with Stars:**
* Trend: Increases slightly from 10% to 20%, then shows a consistent downward trend as training data increases beyond 20%.
* Data Points:
* At 10%: Accuracy = 69.2
* At 20%: Accuracy = 70.8 (Peak)
* At 30%: Accuracy = 67.3
* At 40%: Accuracy = 66.5
* (No data point is plotted for 50%).
4. **SFT Baseline - Dashed Pink Line:**
* Trend: Constant horizontal line, indicating a fixed performance level independent of the training data percentage shown.
* Value: Accuracy = 60.6 (labeled on the right side of the chart).
### Key Observations
* **Performance Hierarchy:** The "Step-Level (Online)" method consistently achieves the highest accuracy across all training data percentages shown.
* **Online vs. Offline:** Both online methods (Step-Level and Instance-Level) significantly outperform the offline method ("Step-Level (Offline)") and the SFT Baseline at all data points.
* **Diminishing Returns/Overfitting:** The "Step-Level (Online)" method's performance plateaus after 30% data. The "Instance-Level (Online)" method's performance drops after 40% data, suggesting potential overfitting or diminishing returns with more data for this method.
* **Offline Method Decline:** The "Step-Level (Offline)" method shows a clear negative correlation between training data percentage and accuracy beyond the 20% mark.
* **Baseline Comparison:** All three experimental methods provide a substantial improvement over the "SFT Baseline" of 60.6 accuracy.
### Interpretation
This chart demonstrates the comparative effectiveness of different training paradigms on the ARC-C benchmark. The data suggests that **online training methods (both Step-Level and Instance-Level) are superior to the offline method and the standard SFT baseline** for this task, yielding accuracy gains of approximately 10-16 percentage points.
The **"Step-Level (Online)" approach appears to be the most robust and effective**, maintaining high performance even as training data increases. The peak performance for this method occurs with 30% of the training data, after which additional data provides minimal benefit.
The **decline in performance for the "Instance-Level (Online)" method at 50% data and the consistent decline for the "Step-Level (Offline)" method** are critical anomalies. They indicate that simply adding more data is not universally beneficial and can be detrimental depending on the training strategy. This could point to issues like overfitting, noise in the additional data, or a mismatch between the training objective and the evaluation metric when data scales.
In summary, the chart argues for the efficacy of online, step-level training for maximizing accuracy on ARC-C, while cautioning that the benefits of increased data are not automatic and are highly dependent on the specific training methodology employed.