\n
## Bar Chart: Theorem Solving Attempts
### Overview
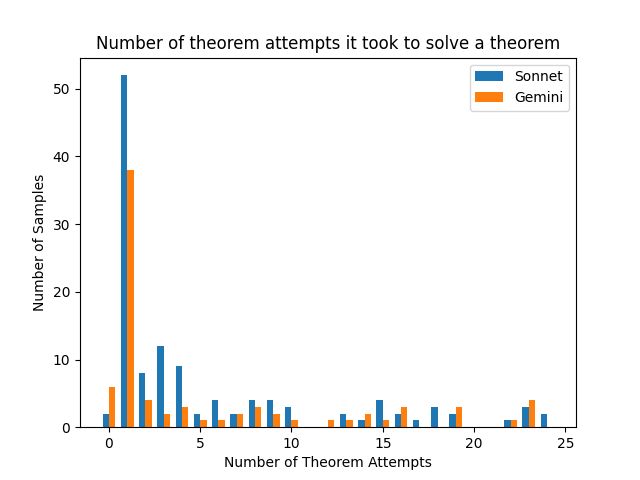
This bar chart compares the number of theorem attempts required to solve a theorem by two different models: "Sonnet" and "Gemini". The x-axis represents the number of theorem attempts, and the y-axis represents the number of samples (frequency). The chart displays the distribution of attempts for each model.
### Components/Axes
* **Title:** "Number of theorem attempts it took to solve a theorem" (centered at the top)
* **X-axis Label:** "Number of Theorem Attempts" (bottom-center)
* Scale: 0 to 25, with increments of 5.
* **Y-axis Label:** "Number of Samples" (left-center)
* Scale: 0 to 50, with increments of 10.
* **Legend:** Located in the top-right corner.
* "Sonnet" - represented by a blue color.
* "Gemini" - represented by an orange color.
### Detailed Analysis
The chart consists of two sets of bars, one for each model.
**Sonnet (Blue):**
The Sonnet model shows a peak in attempts around 1 attempt, with approximately 53 samples. The number of samples decreases rapidly as the number of attempts increases. There are noticeable bars at:
* 0 attempts: ~53 samples
* 1 attempt: ~9 samples
* 2 attempts: ~6 samples
* 3 attempts: ~5 samples
* 4 attempts: ~4 samples
* 5 attempts: ~3 samples
* 6 attempts: ~2 samples
* 7 attempts: ~2 samples
* 8 attempts: ~2 samples
* 9 attempts: ~2 samples
* 10 attempts: ~2 samples
* 11 attempts: ~1 sample
* 12 attempts: ~1 sample
* 13 attempts: ~1 sample
* 14 attempts: ~1 sample
* 15 attempts: ~1 sample
* 16 attempts: ~1 sample
* 17 attempts: ~1 sample
* 18 attempts: ~1 sample
* 19 attempts: ~1 sample
* 20 attempts: ~1 sample
* 21 attempts: ~1 sample
* 22 attempts: ~1 sample
* 23 attempts: ~1 sample
* 24 attempts: ~1 sample
* 25 attempts: ~1 sample
**Gemini (Orange):**
The Gemini model also peaks around 0-1 attempts, but has a higher frequency at 0 attempts than Sonnet. The distribution is more spread out than Sonnet's. There are noticeable bars at:
* 0 attempts: ~39 samples
* 1 attempt: ~7 samples
* 2 attempts: ~4 samples
* 3 attempts: ~3 samples
* 4 attempts: ~3 samples
* 5 attempts: ~2 samples
* 6 attempts: ~2 samples
* 7 attempts: ~2 samples
* 8 attempts: ~1 sample
* 9 attempts: ~1 sample
* 10 attempts: ~1 sample
* 11 attempts: ~1 sample
* 12 attempts: ~1 sample
* 13 attempts: ~1 sample
* 14 attempts: ~1 sample
* 15 attempts: ~1 sample
* 16 attempts: ~1 sample
* 17 attempts: ~1 sample
* 18 attempts: ~1 sample
* 19 attempts: ~1 sample
* 20 attempts: ~1 sample
* 21 attempts: ~1 sample
* 22 attempts: ~1 sample
* 23 attempts: ~1 sample
* 24 attempts: ~1 sample
* 25 attempts: ~1 sample
### Key Observations
* Both models show a strong preference for solving theorems with very few attempts (0-2).
* Sonnet has a higher peak at 1 attempt compared to Gemini.
* Gemini has a higher frequency of solving theorems with 0 attempts compared to Sonnet.
* The distributions for both models are right-skewed, indicating that most theorems are solved with a small number of attempts, but some require significantly more.
### Interpretation
The data suggests that both Sonnet and Gemini are relatively efficient at solving theorems, as the majority of solutions are found with a minimal number of attempts. The difference in the distributions suggests that Gemini might be slightly better at solving theorems on the first attempt, while Sonnet might be more consistent in finding solutions within a few attempts. The long tail of the distributions indicates that there are some theorems that are particularly challenging for both models, requiring a larger number of attempts to solve. This could be due to the complexity of the theorems or limitations in the models' reasoning capabilities. The chart provides a comparative performance analysis of the two models in the context of theorem solving.