## Horizontal Bar Chart: R1-Qwen | GK23EN
### Overview
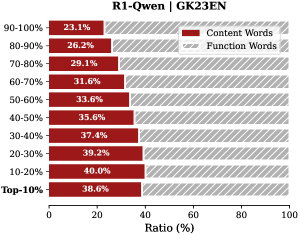
This image is a horizontal stacked bar chart comparing the ratio of "Content Words" to "Function Words" across different percentile ranges of a dataset or model evaluation, likely related to the "R1-Qwen" model on the "GK23EN" benchmark. The chart visualizes how the proportion of these two word categories changes across different performance or frequency tiers.
### Components/Axes
* **Title:** "R1-Qwen | GK23EN" (Top center).
* **Y-Axis (Vertical):** Lists percentile ranges. From top to bottom: "90-100%", "80-90%", "70-80%", "60-70%", "50-60%", "40-50%", "30-40%", "20-30%", "10-20%", "Top-10%".
* **X-Axis (Horizontal):** Labeled "Ratio (%)". Scale runs from 0 to 100 with major tick marks at 0, 20, 40, 60, 80, 100.
* **Legend:** Located in the top-right corner.
* A red rectangle is labeled "Content Words".
* A gray rectangle is labeled "Function Words".
* **Data Series:** Each horizontal bar is a stacked combination of red (Content Words) and gray (Function Words). The red segment is always on the left, starting from 0%.
### Detailed Analysis
The chart displays the following precise ratios for "Content Words" (red segment) for each percentile range. The "Function Words" (gray segment) ratio is the complement to 100%.
| Percentile Range | Content Words Ratio (%) | Function Words Ratio (%) |
| :--- | :--- | :--- |
| 90-100% | 23.1 | 76.9 |
| 80-90% | 26.2 | 73.8 |
| 70-80% | 29.1 | 70.9 |
| 60-70% | 31.6 | 68.4 |
| 50-60% | 33.6 | 66.4 |
| 40-50% | 35.6 | 64.4 |
| 30-40% | 37.4 | 62.6 |
| 20-30% | 39.2 | 60.8 |
| 10-20% | 40.9 | 59.1 |
| Top-10% | 38.6 | 61.4 |
**Trend Verification:** The red bars (Content Words) show a clear, consistent upward trend in length (increasing ratio) as we move from the top of the chart (90-100%) down to the "10-20%" range. The trend reverses slightly for the final "Top-10%" bar, which is shorter than the "10-20%" bar.
### Key Observations
1. **Inverse Relationship:** There is a strong inverse relationship between the percentile tier and the ratio of Content Words. Higher percentile ranges (e.g., 90-100%) are dominated by Function Words (~77%), while lower percentile ranges have a much higher proportion of Content Words.
2. **Peak and Slight Drop:** The proportion of Content Words peaks in the "10-20%" range at 40.9% and then decreases slightly to 38.6% for the "Top-10%" group.
3. **Monotonic Increase:** The increase in Content Word ratio is monotonic and nearly linear from the 90-100% range down to the 10-20% range, with increments between 2-3 percentage points per decile.
4. **Dominance of Function Words:** In all displayed categories, Function Words constitute the majority (over 59%) of the ratio.
### Interpretation
This chart likely analyzes the linguistic composition of text generated by or associated with the R1-Qwen model on the GK23EN benchmark, segmented by some performance metric (e.g., answer correctness, confidence score, or frequency).
* **What the data suggests:** The data demonstrates that higher-performing or more frequent outputs (top percentiles) rely more heavily on **Function Words** (grammatical words like "the", "is", "and"). Conversely, lower-performing or less frequent outputs contain a higher density of **Content Words** (nouns, verbs, adjectives carrying semantic meaning).
* **How elements relate:** The percentile ranges on the y-axis act as the independent variable, directly influencing the dependent variable—the ratio of word types. The clear trend implies a systematic correlation between the model's output quality/category and its lexical choice.
* **Notable patterns/anomalies:** The most significant pattern is the inverse correlation. The slight dip in the "Top-10%" compared to "10-20%" is a minor anomaly that could indicate a different linguistic strategy at the very extreme of the performance spectrum. The consistent majority of Function Words across all tiers is a key finding, suggesting the model's outputs are structurally grammatical regardless of performance tier, but semantic density (Content Words) varies predictably with performance.
**Language Note:** All text in the image is in English.