## Scatter Plot: Accuracy vs. Time-to-Answer
### Overview
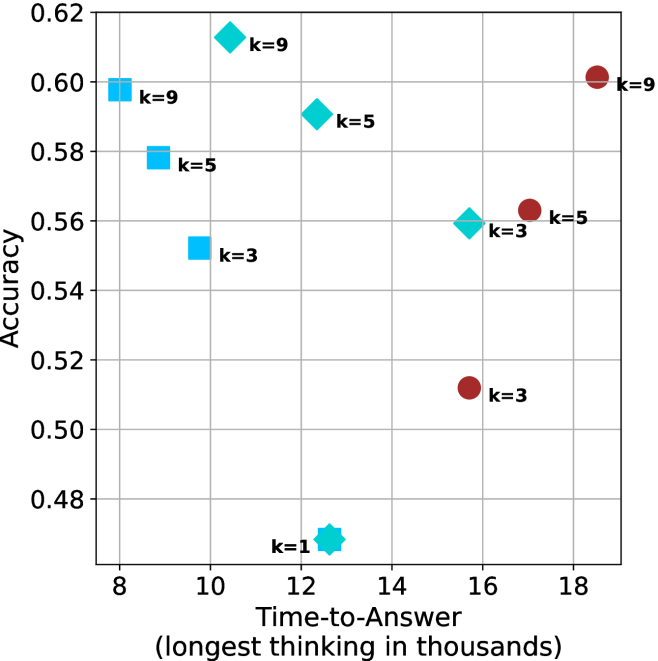
This image is a scatter plot visualizing the relationship between "Time-to-Answer" (measured in thousands of units) and "Accuracy" (a decimal value). The plot categorizes data points into four distinct groups based on marker shape and color, with each point labeled with a 'k' value (k=1, 3, 5, 9). The data suggests a performance comparison between different model configurations or algorithmic approaches.
### Components/Axes
* **Y-Axis:** Labeled "Accuracy". The scale ranges from 0.48 to 0.62, with grid lines at 0.02 intervals.
* **X-Axis:** Labeled "Time-to-Answer (longest thinking in thousands)". The scale ranges from 8 to 18, with grid lines at 2-unit intervals.
* **Data Series (Legend/Markers):**
* **Blue Squares:** Located on the left side of the chart (x < 11).
* **Cyan Diamonds:** Located in the center of the chart (10 < x < 16).
* **Cyan Star/Cross:** A single point located at the bottom center.
* **Maroon Circles:** Located on the right side of the chart (x > 15).
### Detailed Analysis
The data points are grouped by color/shape, representing distinct clusters. Below are the approximate coordinates (x, y) for each point:
**1. Blue Squares (Left Cluster)**
* **k=9:** Positioned at approximately (8.0, 0.60).
* **k=5:** Positioned at approximately (9.0, 0.58).
* **k=3:** Positioned at approximately (10.0, 0.55).
* *Trend:* Within this cluster, as 'k' increases, both accuracy and time-to-answer increase.
**2. Cyan Diamonds (Middle Cluster)**
* **k=9:** Positioned at approximately (10.5, 0.615).
* **k=5:** Positioned at approximately (12.5, 0.59).
* **k=3:** Positioned at approximately (15.5, 0.56).
* *Trend:* Similar to the blue squares, increasing 'k' correlates with higher accuracy and higher time-to-answer.
**3. Cyan Star (Bottom Center)**
* **k=1:** Positioned at approximately (12.5, 0.47).
* *Note:* This is the lowest accuracy point on the entire chart.
**4. Maroon Circles (Right Cluster)**
* **k=9:** Positioned at approximately (18.5, 0.60).
* **k=5:** Positioned at approximately (17.0, 0.565).
* **k=3:** Positioned at approximately (15.5, 0.51).
* *Trend:* This cluster follows the same positive correlation between 'k' and accuracy, but operates at a significantly higher time-to-answer cost compared to the other clusters.
### Key Observations
* **Efficiency Clusters:** The data clearly separates into three efficiency tiers. The Blue Squares are the most efficient (fastest time for given accuracy), followed by the Cyan Diamonds, with the Maroon Circles being the least efficient (slowest time for similar accuracy).
* **Peak Performance:** The highest accuracy achieved is by the Cyan Diamond (k=9) at approximately 0.615 accuracy with a time of ~10.5.
* **Outlier:** The Cyan Star (k=1) is a significant outlier, showing the lowest accuracy (0.47) despite having a moderate time-to-answer (12.5).
* **Consistent Scaling:** Across all three main clusters (Blue, Cyan, Maroon), increasing the 'k' value consistently improves accuracy but incurs a penalty in time-to-answer.
### Interpretation
The data demonstrates a clear trade-off between computational time and model accuracy.
1. **Model Families:** The distinct clusters (Blue, Cyan, Maroon) likely represent three different model architectures or families. The Blue family is superior in terms of Pareto efficiency—it achieves high accuracy (up to 0.60) with the lowest time-to-answer (8-10).
2. **Diminishing Returns:** While increasing 'k' generally improves accuracy, the "cost" in time-to-answer varies wildly between architectures. For example, the Maroon architecture requires ~18.5 units of time to reach 0.60 accuracy, whereas the Blue architecture reaches the same accuracy in ~8 units of time.
3. **Strategic Choice:** If the goal is maximum accuracy, the Cyan Diamond (k=9) is the optimal choice (0.615 accuracy). If the goal is efficiency, the Blue architecture is preferable. The Maroon architecture appears to be the least desirable, as it consumes the most time while failing to outperform the peak accuracy of the other two groups.