\n
## Chart: Receiver Operating Characteristic (ROC) Curves
### Overview
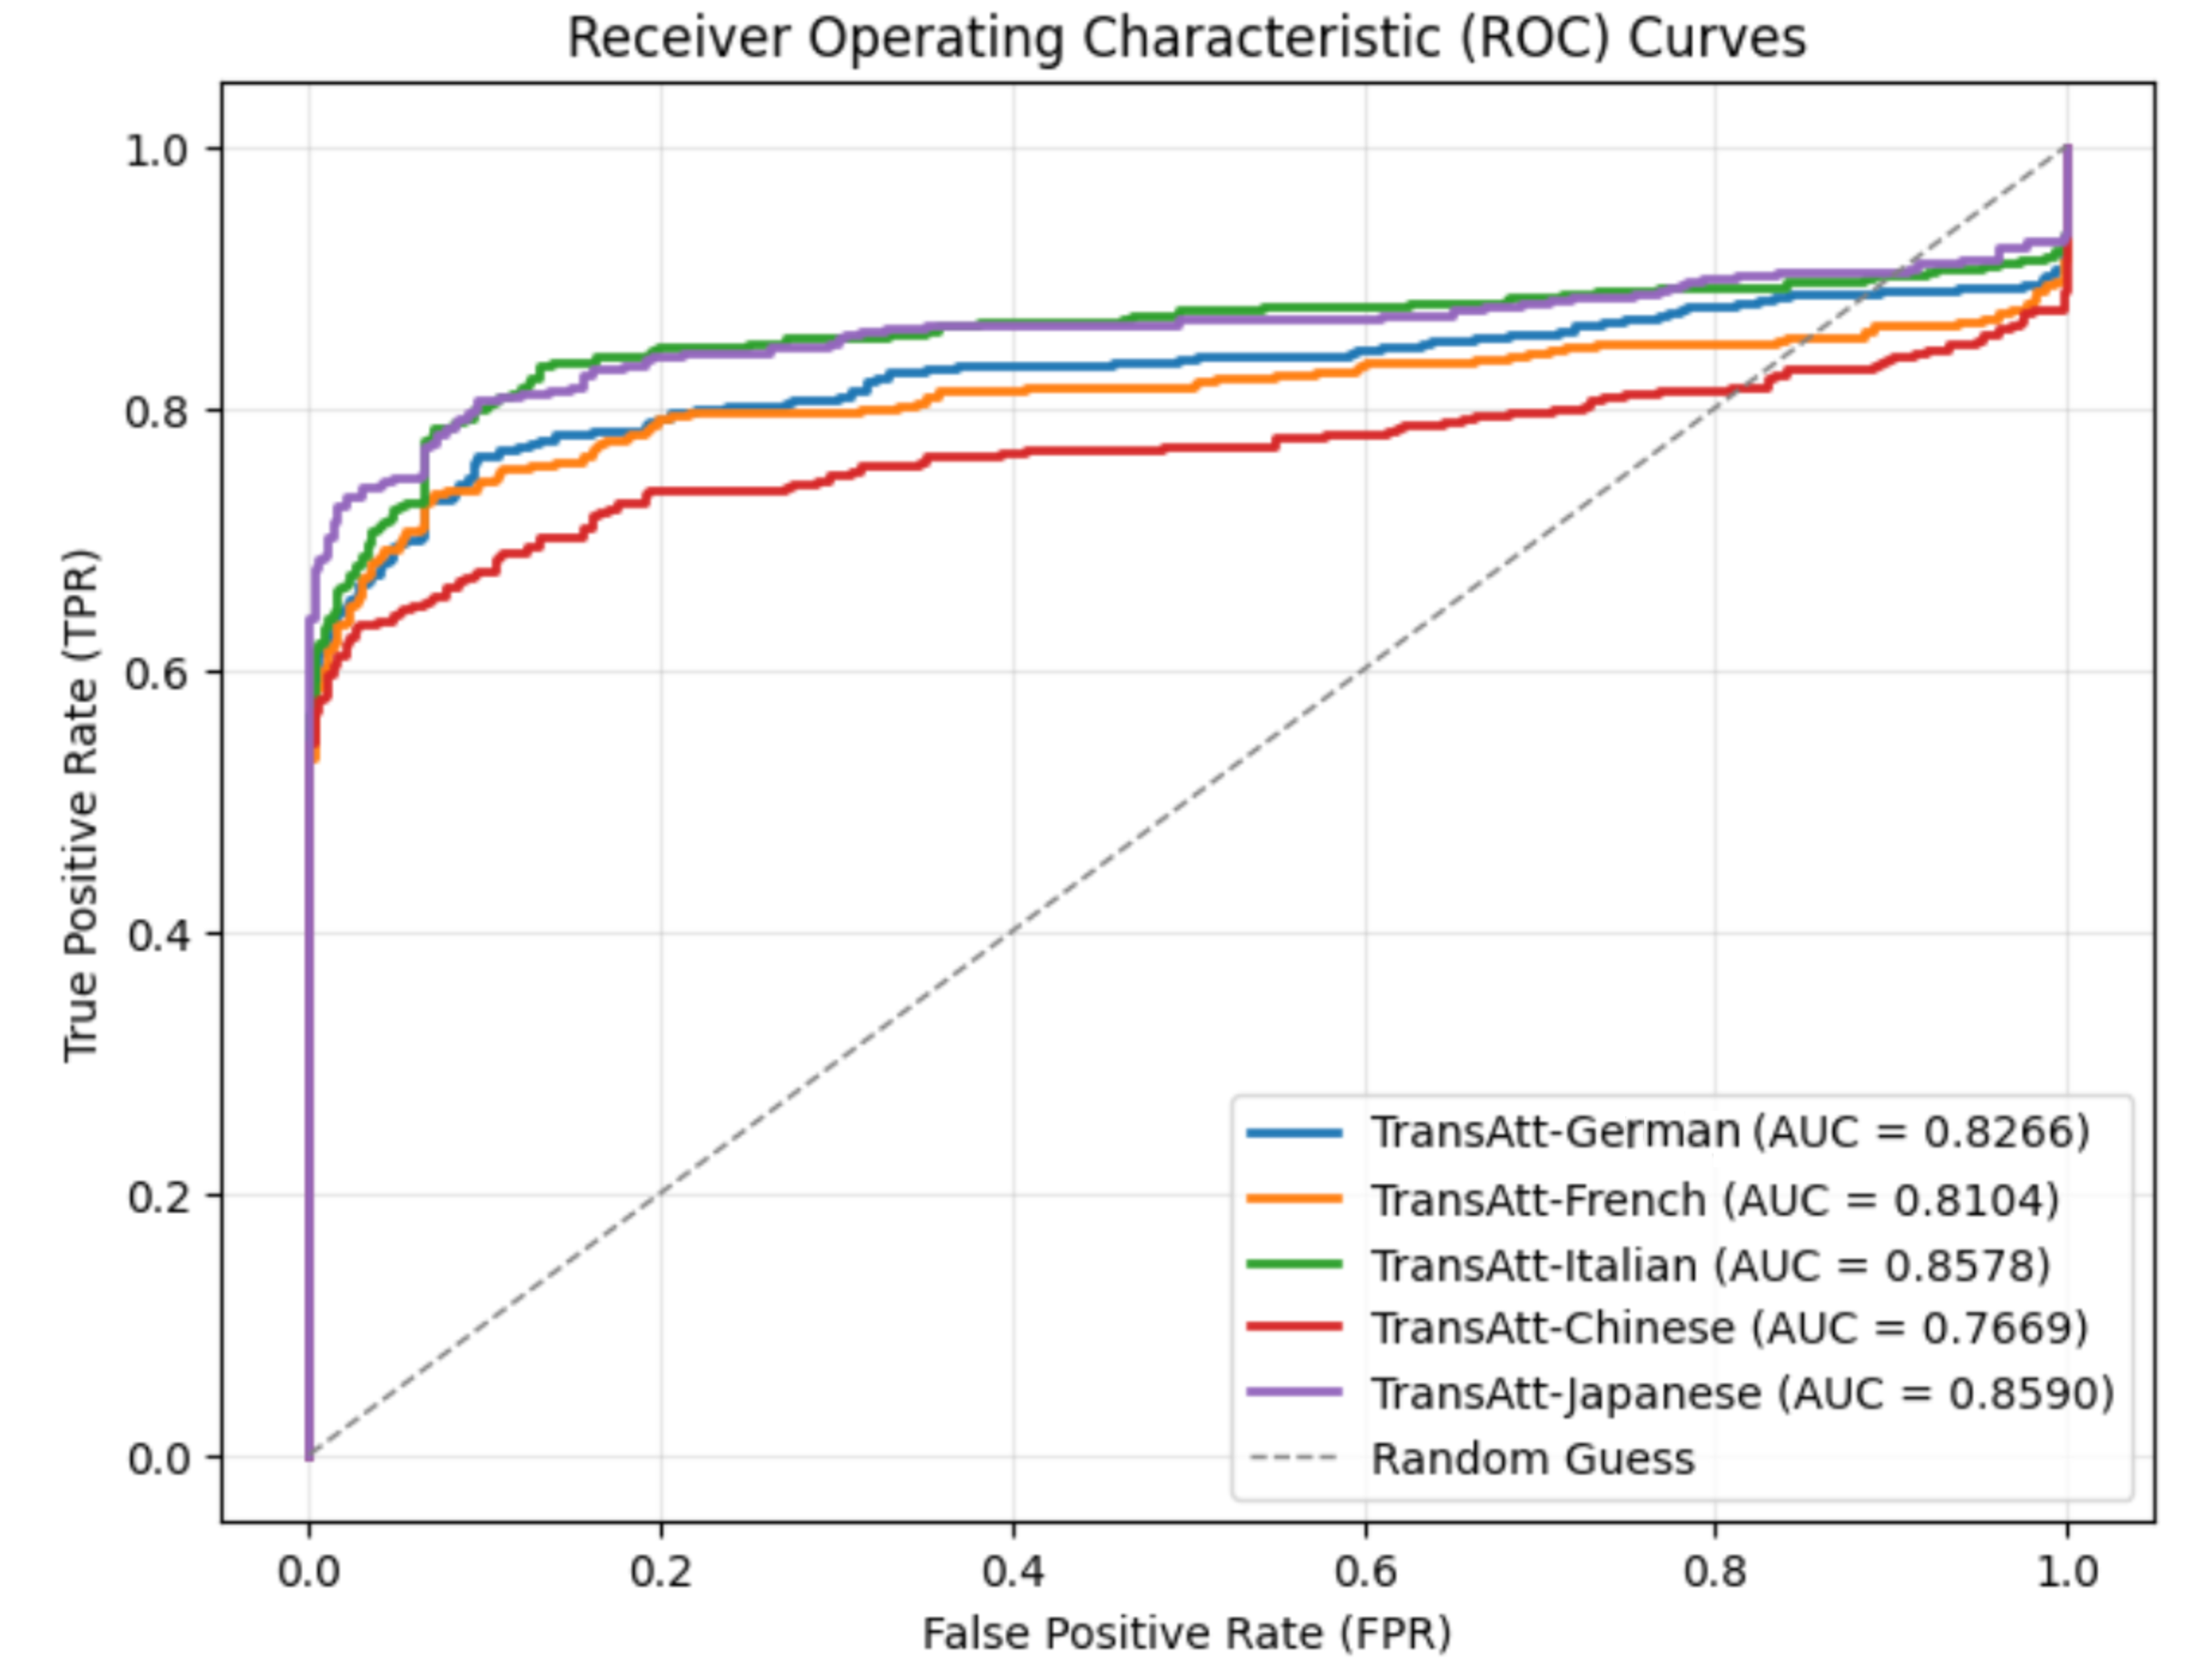
The image displays Receiver Operating Characteristic (ROC) curves for five different language models (German, French, Italian, Chinese, and Japanese) alongside a random guess baseline. The curves plot the True Positive Rate (TPR) against the False Positive Rate (FPR) for each model, and the Area Under the Curve (AUC) is provided for each.
### Components/Axes
* **Title:** Receiver Operating Characteristic (ROC) Curves
* **X-axis:** False Positive Rate (FPR) - Scale: 0.0 to 1.0
* **Y-axis:** True Positive Rate (TPR) - Scale: 0.0 to 1.0
* **Legend:** Located in the bottom-right corner. Contains the following entries:
* TransAtt-German (Blue) - AUC = 0.8266
* TransAtt-French (Orange) - AUC = 0.8104
* TransAtt-Italian (Yellow) - AUC = 0.8578
* TransAtt-Chinese (Red) - AUC = 0.7669
* TransAtt-Japanese (Purple) - AUC = 0.8590
* Random Guess (Gray dashed line)
### Detailed Analysis
* **TransAtt-German (Blue):** The curve starts at approximately (0.0, 0.6) and rises to approximately (0.95, 0.95). It shows a generally upward trend, indicating good performance. AUC = 0.8266.
* **TransAtt-French (Orange):** The curve begins at around (0.0, 0.65) and reaches approximately (0.9, 0.9). It exhibits a relatively stable performance. AUC = 0.8104.
* **TransAtt-Italian (Yellow):** This curve starts at approximately (0.0, 0.7) and rises to approximately (0.95, 0.95). It demonstrates strong performance. AUC = 0.8578.
* **TransAtt-Chinese (Red):** The curve starts at around (0.0, 0.6) and reaches approximately (0.9, 0.85). It shows a less steep upward trend compared to the other models. AUC = 0.7669.
* **TransAtt-Japanese (Purple):** The curve begins at approximately (0.0, 0.7) and rises to approximately (0.95, 0.95). It shows a strong upward trend. AUC = 0.8590.
* **Random Guess (Gray dashed line):** This line represents the performance of a random classifier. It starts at (0.0, 0.0) and ends at (1.0, 1.0), forming a diagonal line.
### Key Observations
* The Italian and Japanese models have the highest AUC scores (0.8578 and 0.8590 respectively), indicating the best performance among the tested languages.
* The Chinese model has the lowest AUC score (0.7669), suggesting the poorest performance.
* All language models perform better than the random guess baseline.
* The curves for German, French, Italian, and Japanese are relatively close to each other, indicating similar performance levels.
### Interpretation
The ROC curves demonstrate the ability of each language model to distinguish between positive and negative cases. A higher AUC score indicates better performance, meaning the model is more capable of correctly identifying positive cases while minimizing false positives. The Italian and Japanese models exhibit the strongest ability to discriminate, while the Chinese model struggles comparatively. The fact that all models outperform the random guess suggests they all possess some degree of predictive power. The differences in AUC scores likely reflect variations in the complexity of the languages, the quality of the training data, or the effectiveness of the model architecture for each language. The curves provide a visual representation of the trade-off between sensitivity (TPR) and specificity (1-FPR) for each model, allowing for a comprehensive evaluation of their performance.