## Bar Charts: Normalized Latency and Broadcast-to-Root Cycle Counts
### Overview
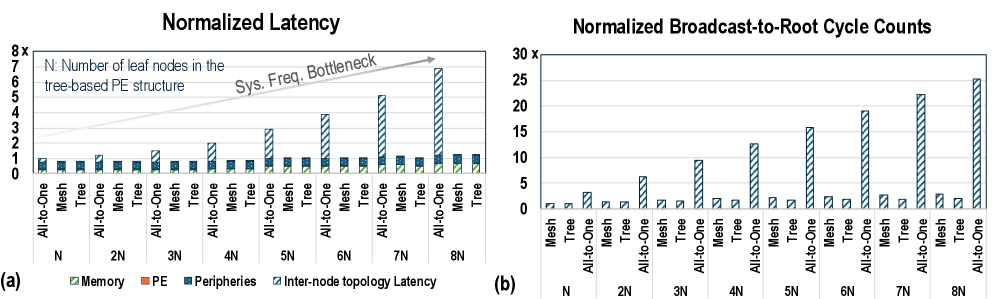
The image contains two bar charts comparing the performance of different network topologies (Mesh, Tree, and All-to-One) with varying numbers of leaf nodes (N). The left chart (a) shows normalized latency, while the right chart (b) shows normalized broadcast-to-root cycle counts.
### Components/Axes
**Chart (a): Normalized Latency**
* **Title:** Normalized Latency
* **Y-axis:** Normalized Latency, scaled from 0 to 8x.
* **X-axis:** Number of leaf nodes in the tree-based PE structure, labeled as N, 2N, 3N, 4N, 5N, 6N, 7N, and 8N.
* **Categories:** For each N value, there are three network topologies: All-to-One, Mesh, and Tree.
* **Legend (bottom-left):**
* Memory (light green)
* PE (orange)
* Peripheries (blue)
* Inter-node topology Latency (dark blue with diagonal lines)
* **Annotation:** "Sys. Freq. Bottleneck" with an arrow pointing towards the increasing Inter-node topology Latency bars.
**Chart (b): Normalized Broadcast-to-Root Cycle Counts**
* **Title:** Normalized Broadcast-to-Root Cycle Counts
* **Y-axis:** Normalized Broadcast-to-Root Cycle Counts, scaled from 0 to 30x.
* **X-axis:** Number of leaf nodes in the tree-based PE structure, labeled as N, 2N, 3N, 4N, 5N, 6N, 7N, and 8N.
* **Categories:** For each N value, there are three network topologies: Mesh, Tree, and All-to-One.
* **Legend:** Not explicitly present, but the bars represent the cycle counts for each topology.
### Detailed Analysis
**Chart (a): Normalized Latency**
* **Memory (light green):** Relatively constant across all N values and topologies, hovering around 0.1-0.2.
* **PE (orange):** Relatively constant across all N values and topologies, hovering around 0.1-0.2.
* **Peripheries (blue):** Relatively constant across all N values and topologies, hovering around 0.5-0.7.
* **Inter-node topology Latency (dark blue with diagonal lines):**
* For Mesh and Tree topologies, the latency remains relatively constant around 0.1-0.2.
* For All-to-One topology, the latency increases significantly with increasing N values:
* N: ~0.8
* 2N: ~1.2
* 3N: ~1.5
* 4N: ~2.8
* 5N: ~1.2
* 6N: ~2.8
* 7N: ~5.0
* 8N: ~6.8
**Chart (b): Normalized Broadcast-to-Root Cycle Counts**
* **Mesh:** Cycle counts remain low and relatively constant across all N values, approximately between 0.5 and 1.
* **Tree:** Cycle counts remain low and relatively constant across all N values, approximately between 0.5 and 1.
* **All-to-One:** Cycle counts increase significantly with increasing N values:
* N: ~2.5
* 2N: ~6.5
* 3N: ~9.5
* 4N: ~2.5
* 5N: ~16
* 6N: ~2.5
* 7N: ~22.5
* 8N: ~25
### Key Observations
* In the Normalized Latency chart, the Inter-node topology Latency for the All-to-One topology increases significantly with increasing N, while the Mesh and Tree topologies remain relatively constant.
* In the Normalized Broadcast-to-Root Cycle Counts chart, the All-to-One topology shows a significant increase in cycle counts with increasing N, while the Mesh and Tree topologies remain relatively constant.
* The "Sys. Freq. Bottleneck" annotation suggests that the increasing latency in the All-to-One topology is due to a system frequency bottleneck.
### Interpretation
The data suggests that the All-to-One topology suffers from scalability issues as the number of leaf nodes (N) increases. This is evident in both the normalized latency and the broadcast-to-root cycle counts. The Mesh and Tree topologies, on the other hand, appear to be more scalable, maintaining relatively constant latency and cycle counts across different N values. The "Sys. Freq. Bottleneck" annotation indicates that the increasing latency in the All-to-One topology is likely due to limitations in the system frequency, which becomes a bottleneck as the communication demands increase with more leaf nodes. The charts highlight the trade-offs between different network topologies and their suitability for different scales of parallel processing.