## Chart/Diagram Type: Comparative Performance Analysis (Normalized Latency and Cycle Counts)
### Overview
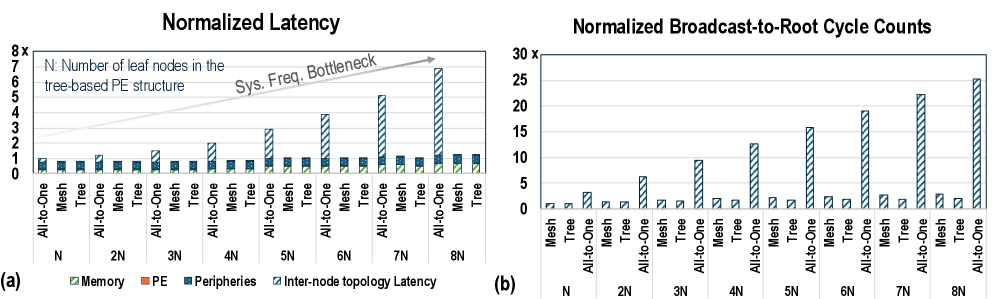
This image displays two bar charts, labeled (a) and (b), comparing the performance of three different network topologies ("All-to-One", "Mesh", and "Tree") across varying system sizes (N to 8N).
* **Chart (a)** illustrates "Normalized Latency," highlighting how different components (Memory, PE, Peripheries, Inter-node topology Latency) contribute to total latency.
* **Chart (b)** illustrates "Normalized Broadcast-to-Root Cycle Counts," showing the efficiency of the topologies in broadcast operations.
### Components/Axes
**Shared Legend (Bottom):**
* **Green diagonal stripes:** Memory
* **Orange solid:** PE (Processing Element)
* **Blue dots:** Peripheries
* **Blue diagonal stripes:** Inter-node topology Latency
**Chart (a) - Normalized Latency:**
* **Y-axis:** Normalized Latency, scaled from 0 to 8x.
* **X-axis:** Number of leaf nodes (N, 2N, 3N, 4N, 5N, 6N, 7N, 8N).
* **Sub-categories (per group):** All-to-One, Mesh, Tree.
* **Annotation:** An arrow pointing from N to 8N labeled "Sys. Freq. Bottleneck," indicating an increasing performance constraint for the All-to-One topology.
* **Note:** "N: Number of leaf nodes in the tree-based PE structure."
**Chart (b) - Normalized Broadcast-to-Root Cycle Counts:**
* **Y-axis:** Normalized Broadcast-to-Root Cycle Counts, scaled from 0 to 30x.
* **X-axis:** Number of leaf nodes (N, 2N, 3N, 4N, 5N, 6N, 7N, 8N).
* **Sub-categories (per group):** Mesh, Tree, All-to-One.
---
### Detailed Analysis
#### Chart (a): Normalized Latency
* **Trend:** The "All-to-One" topology shows a dramatic, near-linear increase in "Inter-node topology Latency" as the number of nodes increases from N to 8N. Conversely, "Mesh" and "Tree" topologies maintain a consistently low, flat latency profile across all node counts.
* **Data Points (Approximate):**
* **N:** All-to-One (~1.1x), Mesh (~0.9x), Tree (~0.9x).
* **4N:** All-to-One (~3.0x), Mesh (~0.9x), Tree (~0.9x).
* **8N:** All-to-One (~6.8x), Mesh (~0.9x), Tree (~0.9x).
* **Composition:** In the "All-to-One" bars, the "Inter-node topology Latency" (blue diagonal stripes) constitutes the vast majority of the bar height as N increases, dwarfing the constant "Memory," "PE," and "Peripheries" components.
#### Chart (b): Normalized Broadcast-to-Root Cycle Counts
* **Trend:** The "All-to-One" topology exhibits a steep, upward trend in cycle counts as the system scales. "Mesh" and "Tree" topologies remain extremely efficient, showing very low, nearly flat cycle counts regardless of the number of nodes.
* **Data Points (Approximate):**
* **N:** Mesh (~1x), Tree (~1x), All-to-One (~3x).
* **4N:** Mesh (~2x), Tree (~2x), All-to-One (~12.5x).
* **8N:** Mesh (~2.5x), Tree (~2.5x), All-to-One (~25x).
---
### Key Observations
1. **Scalability Gap:** There is a massive performance disparity between the "All-to-One" topology and the "Mesh/Tree" topologies. As the system scales to 8N, "All-to-One" becomes significantly less efficient.
2. **Bottleneck Identification:** In chart (a), the "Sys. Freq. Bottleneck" annotation explicitly identifies that the "All-to-One" structure suffers from a system frequency bottleneck, which manifests as increased inter-node latency.
3. **Consistency:** The "Mesh" and "Tree" topologies demonstrate excellent scalability, with performance metrics remaining relatively stable even as the number of nodes increases eightfold.
### Interpretation
The data demonstrates that the "All-to-One" communication pattern is fundamentally unscalable for larger systems. The linear growth in both latency and cycle counts suggests that the "All-to-One" approach creates a serialization point or contention at the root node, which becomes increasingly severe as more leaf nodes are added.
The "Mesh" and "Tree" topologies, by contrast, likely utilize distributed communication paths that avoid this bottleneck, allowing them to maintain constant performance. The "Sys. Freq. Bottleneck" annotation in chart (a) implies that the latency penalty in "All-to-One" is not merely a software overhead but is tied to the physical or architectural limits of the interconnect frequency when handling the increased traffic volume of an All-to-One pattern. This suggests that for any system design requiring scalability beyond N, "All-to-One" should be avoided in favor of "Mesh" or "Tree" structures.