## Line Chart: Score vs. Generation for Different Initial Populations
### Overview
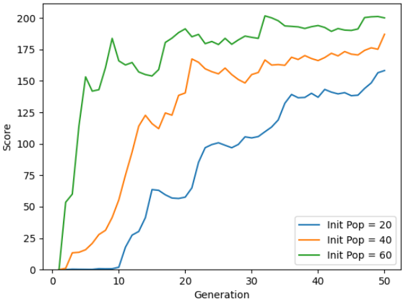
The image is a line chart comparing the "Score" achieved over "Generation" for three different initial population sizes: 20, 40, and 60. The chart shows how the score evolves over 50 generations for each population size.
### Components/Axes
* **X-axis:** Generation, ranging from 0 to 50.
* **Y-axis:** Score, ranging from 0 to 200.
* **Legend (bottom-right):**
* Blue line: Init Pop = 20
* Orange line: Init Pop = 40
* Green line: Init Pop = 60
### Detailed Analysis
* **Init Pop = 20 (Blue Line):**
* The score remains near 0 for the first 8 generations.
* From generation 8 to 20, the score increases from approximately 0 to 60.
* From generation 20 to 30, the score fluctuates between 55 and 65.
* From generation 30 to 50, the score increases from approximately 65 to 160.
* **Init Pop = 40 (Orange Line):**
* The score remains near 0 for the first 3 generations.
* From generation 3 to 15, the score increases from approximately 0 to 120.
* From generation 15 to 35, the score increases from approximately 120 to 170.
* From generation 35 to 50, the score fluctuates between 160 and 170.
* **Init Pop = 60 (Green Line):**
* The score increases rapidly from 0 to 150 within the first 7 generations.
* From generation 7 to 20, the score fluctuates between 150 and 190.
* From generation 20 to 35, the score remains relatively stable around 190.
* From generation 35 to 50, the score fluctuates between 180 and 200.
### Key Observations
* The green line (Init Pop = 60) consistently achieves the highest score throughout the generations.
* The blue line (Init Pop = 20) shows the slowest initial growth but eventually reaches a score comparable to the orange line (Init Pop = 40) by generation 50.
* All three lines show an initial period of rapid score increase, followed by a period of stabilization or slower growth.
### Interpretation
The chart suggests that a larger initial population size (Init Pop = 60) leads to a faster and higher score in the early generations. However, the smaller initial population sizes eventually catch up, indicating that the initial population size has a greater impact on the initial learning rate than the final performance. The fluctuations in the score suggest that there is some variability in the performance of each generation, possibly due to random factors in the simulation or learning process. The data demonstrates that increasing the initial population size can improve the initial performance of the system, but it may not necessarily lead to a significantly higher final score.