\n
## Line Chart: Surprisal vs. Training Steps
### Overview
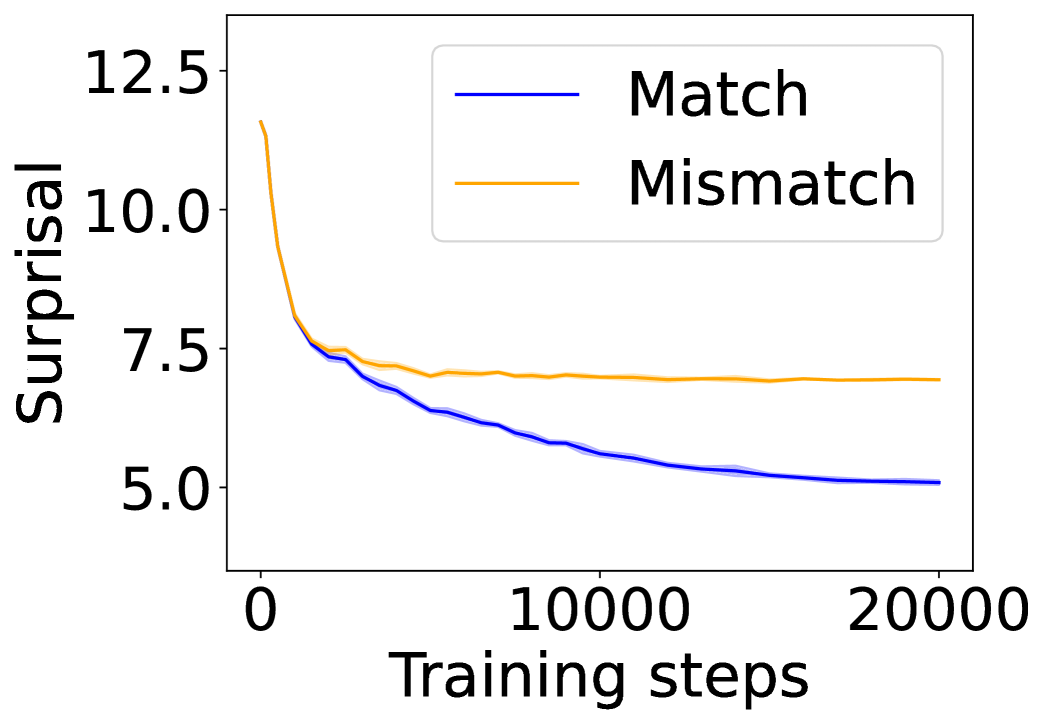
The image displays a line chart plotting "Surprisal" on the vertical axis against "Training steps" on the horizontal axis. It compares the performance of two conditions, labeled "Match" and "Mismatch," over the course of 20,000 training steps. The chart demonstrates how the surprisal metric evolves for each condition as training progresses.
### Components/Axes
* **X-Axis (Horizontal):**
* **Label:** "Training steps"
* **Scale:** Linear scale from 0 to 20,000.
* **Major Tick Marks:** Located at 0, 10,000, and 20,000.
* **Y-Axis (Vertical):**
* **Label:** "Surprisal"
* **Scale:** Linear scale from approximately 4.5 to 13.0.
* **Major Tick Marks:** Located at 5.0, 7.5, 10.0, and 12.5.
* **Legend:**
* **Position:** Top-right corner of the chart area.
* **Items:**
1. **Match:** Represented by a solid blue line.
2. **Mismatch:** Represented by a solid orange line.
### Detailed Analysis
**1. "Match" Series (Blue Line):**
* **Trend:** The line exhibits a consistent, monotonic downward slope throughout the entire training period.
* **Data Points (Approximate):**
* At step 0: Surprisal ≈ 12.5
* At step ~2,500: Surprisal ≈ 7.5
* At step 10,000: Surprisal ≈ 6.0
* At step 20,000: Surprisal ≈ 5.0
* **Variance:** A faint, light-blue shaded region surrounds the main blue line, indicating the presence of variance, standard deviation, or a confidence interval around the mean trend. This shaded area is narrow, suggesting relatively low variance in the "Match" condition's performance.
**2. "Mismatch" Series (Orange Line):**
* **Trend:** The line shows a steep initial decline followed by a clear plateau.
* **Data Points (Approximate):**
* At step 0: Surprisal ≈ 12.5 (similar starting point to "Match").
* At step ~2,500: Surprisal ≈ 7.5 (briefly aligns with the "Match" line).
* From step ~5,000 onward: The line flattens significantly.
* At step 10,000: Surprisal ≈ 7.2
* At step 20,000: Surprisal ≈ 7.0
* **Variance:** No visible shaded region or error band is present for the orange line.
### Key Observations
1. **Diverging Paths:** Both conditions start at a similar high surprisal value (~12.5). They follow a nearly identical path for the first ~2,500 steps, after which their trajectories diverge sharply.
2. **Plateau vs. Continuous Improvement:** The "Mismatch" condition's performance plateaus early (around step 5,000) and shows negligible improvement for the remaining 15,000 steps. In contrast, the "Match" condition continues to improve steadily throughout the entire training run.
3. **Final Performance Gap:** By the end of training (step 20,000), a substantial gap exists between the two conditions. The "Match" condition achieves a surprisal of ~5.0, while the "Mismatch" condition is stuck at ~7.0.
4. **Variance Indication:** The presence of a shaded error band only on the "Match" line suggests that either the variance is only reported for that condition, or the variance for the "Mismatch" condition is too small to be visually rendered.
### Interpretation
This chart likely illustrates a fundamental concept in machine learning or model training, where "surprisal" is a measure of prediction error or uncertainty (lower is better).
* **What the Data Suggests:** The data demonstrates that the model's ability to reduce surprisal (i.e., learn and make better predictions) is critically dependent on the "Match" condition. The "Mismatch" condition leads to a learning bottleneck, where the model quickly reaches a performance ceiling and cannot improve further, despite additional training.
* **Relationship Between Elements:** The initial parallel descent indicates that both conditions provide useful learning signals early on. The divergence point (~2,500 steps) likely marks where the inherent limitations of the "Mismatch" data or setup begin to constrain the model's capacity for further learning.
* **Notable Anomaly/Insight:** The most significant finding is the stark contrast in long-term learning dynamics. The "Match" condition enables sustained, incremental improvement, while the "Mismatch" condition results in rapid convergence to a suboptimal solution. This implies that for this specific task and model, the quality or nature of the training signal (matched vs. mismatched) is a primary determinant of final model performance, more so than the sheer volume of training steps beyond a certain point.