## Line Graph: Surprisal vs Training Steps
### Overview
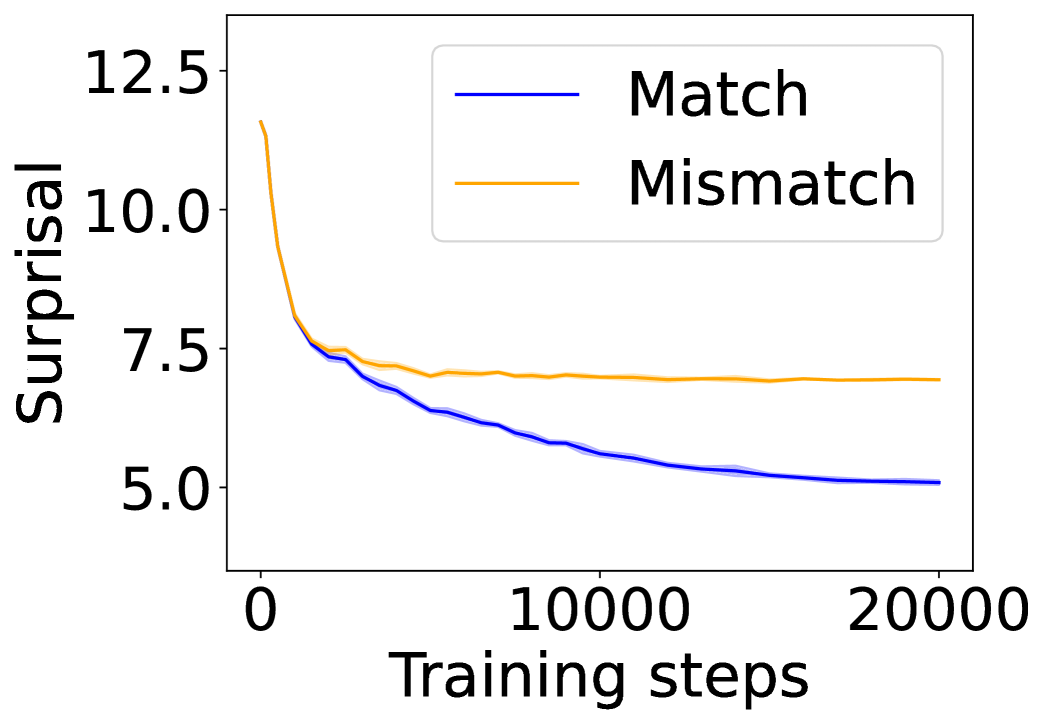
The image depicts a line graph comparing two data series ("Match" and "Mismatch") across 20,000 training steps. Both lines show decreasing trends in "Surprisal" values, with distinct initial trajectories and convergence patterns.
### Components/Axes
- **Y-axis (Surprisal)**: Labeled "Surprisal" with values ranging from 5.0 to 12.5 in increments of 2.5.
- **X-axis (Training steps)**: Labeled "Training steps" with values from 0 to 20,000 in increments of 10,000.
- **Legend**: Located in the top-right corner, with:
- **Blue line**: "Match"
- **Orange line**: "Mismatch"
### Detailed Analysis
1. **Initial Values (0 training steps)**:
- "Match" (blue): Starts at ~12.5
- "Mismatch" (orange): Starts at ~11.5
2. **Early Decline (0–5,000 steps)**:
- "Match" drops sharply from 12.5 to ~7.5
- "Mismatch" declines gradually from 11.5 to ~7.0
3. **Midpoint (10,000 steps)**:
- Both lines converge near ~6.5
4. **Late Training (20,000 steps)**:
- "Match": ~5.2
- "Mismatch": ~5.0
### Key Observations
- **Convergence**: Both lines merge near 10,000 steps and remain parallel thereafter.
- **Rate of Change**: "Match" shows a steeper initial decline compared to "Mismatch."
- **Stabilization**: Surprisal values plateau after ~15,000 steps for both conditions.
### Interpretation
The data suggests that:
1. **Learning Dynamics**: The rapid decline in "Match" surprisal indicates faster adaptation to predictable patterns, while "Mismatch" reflects slower learning from less predictable data.
2. **Model Robustness**: Convergence at later stages implies the model achieves similar generalization performance regardless of input type after sufficient training.
3. **Surprisal Thresholds**: The final surprisal values (~5.0–5.2) may represent the model's baseline uncertainty floor for both conditions.
No anomalies or outliers are observed. The graph demonstrates a clear trade-off between initial data predictability and long-term model performance.