TECHNICAL ASSET FINGERPRINT
198e5ba9f42a4eb767b9e83e
Click to view fullscreen
Press ESC or click to close
FOUND IN PAPERS
EXPERT: gemma-3-27b-it-free VERSION 1
RUNTIME: google-free/gemma-3-27b-it
INTEL_VERIFIED
## Box Plot: Error (1-AUC) Across Fairness Interventions
### Overview
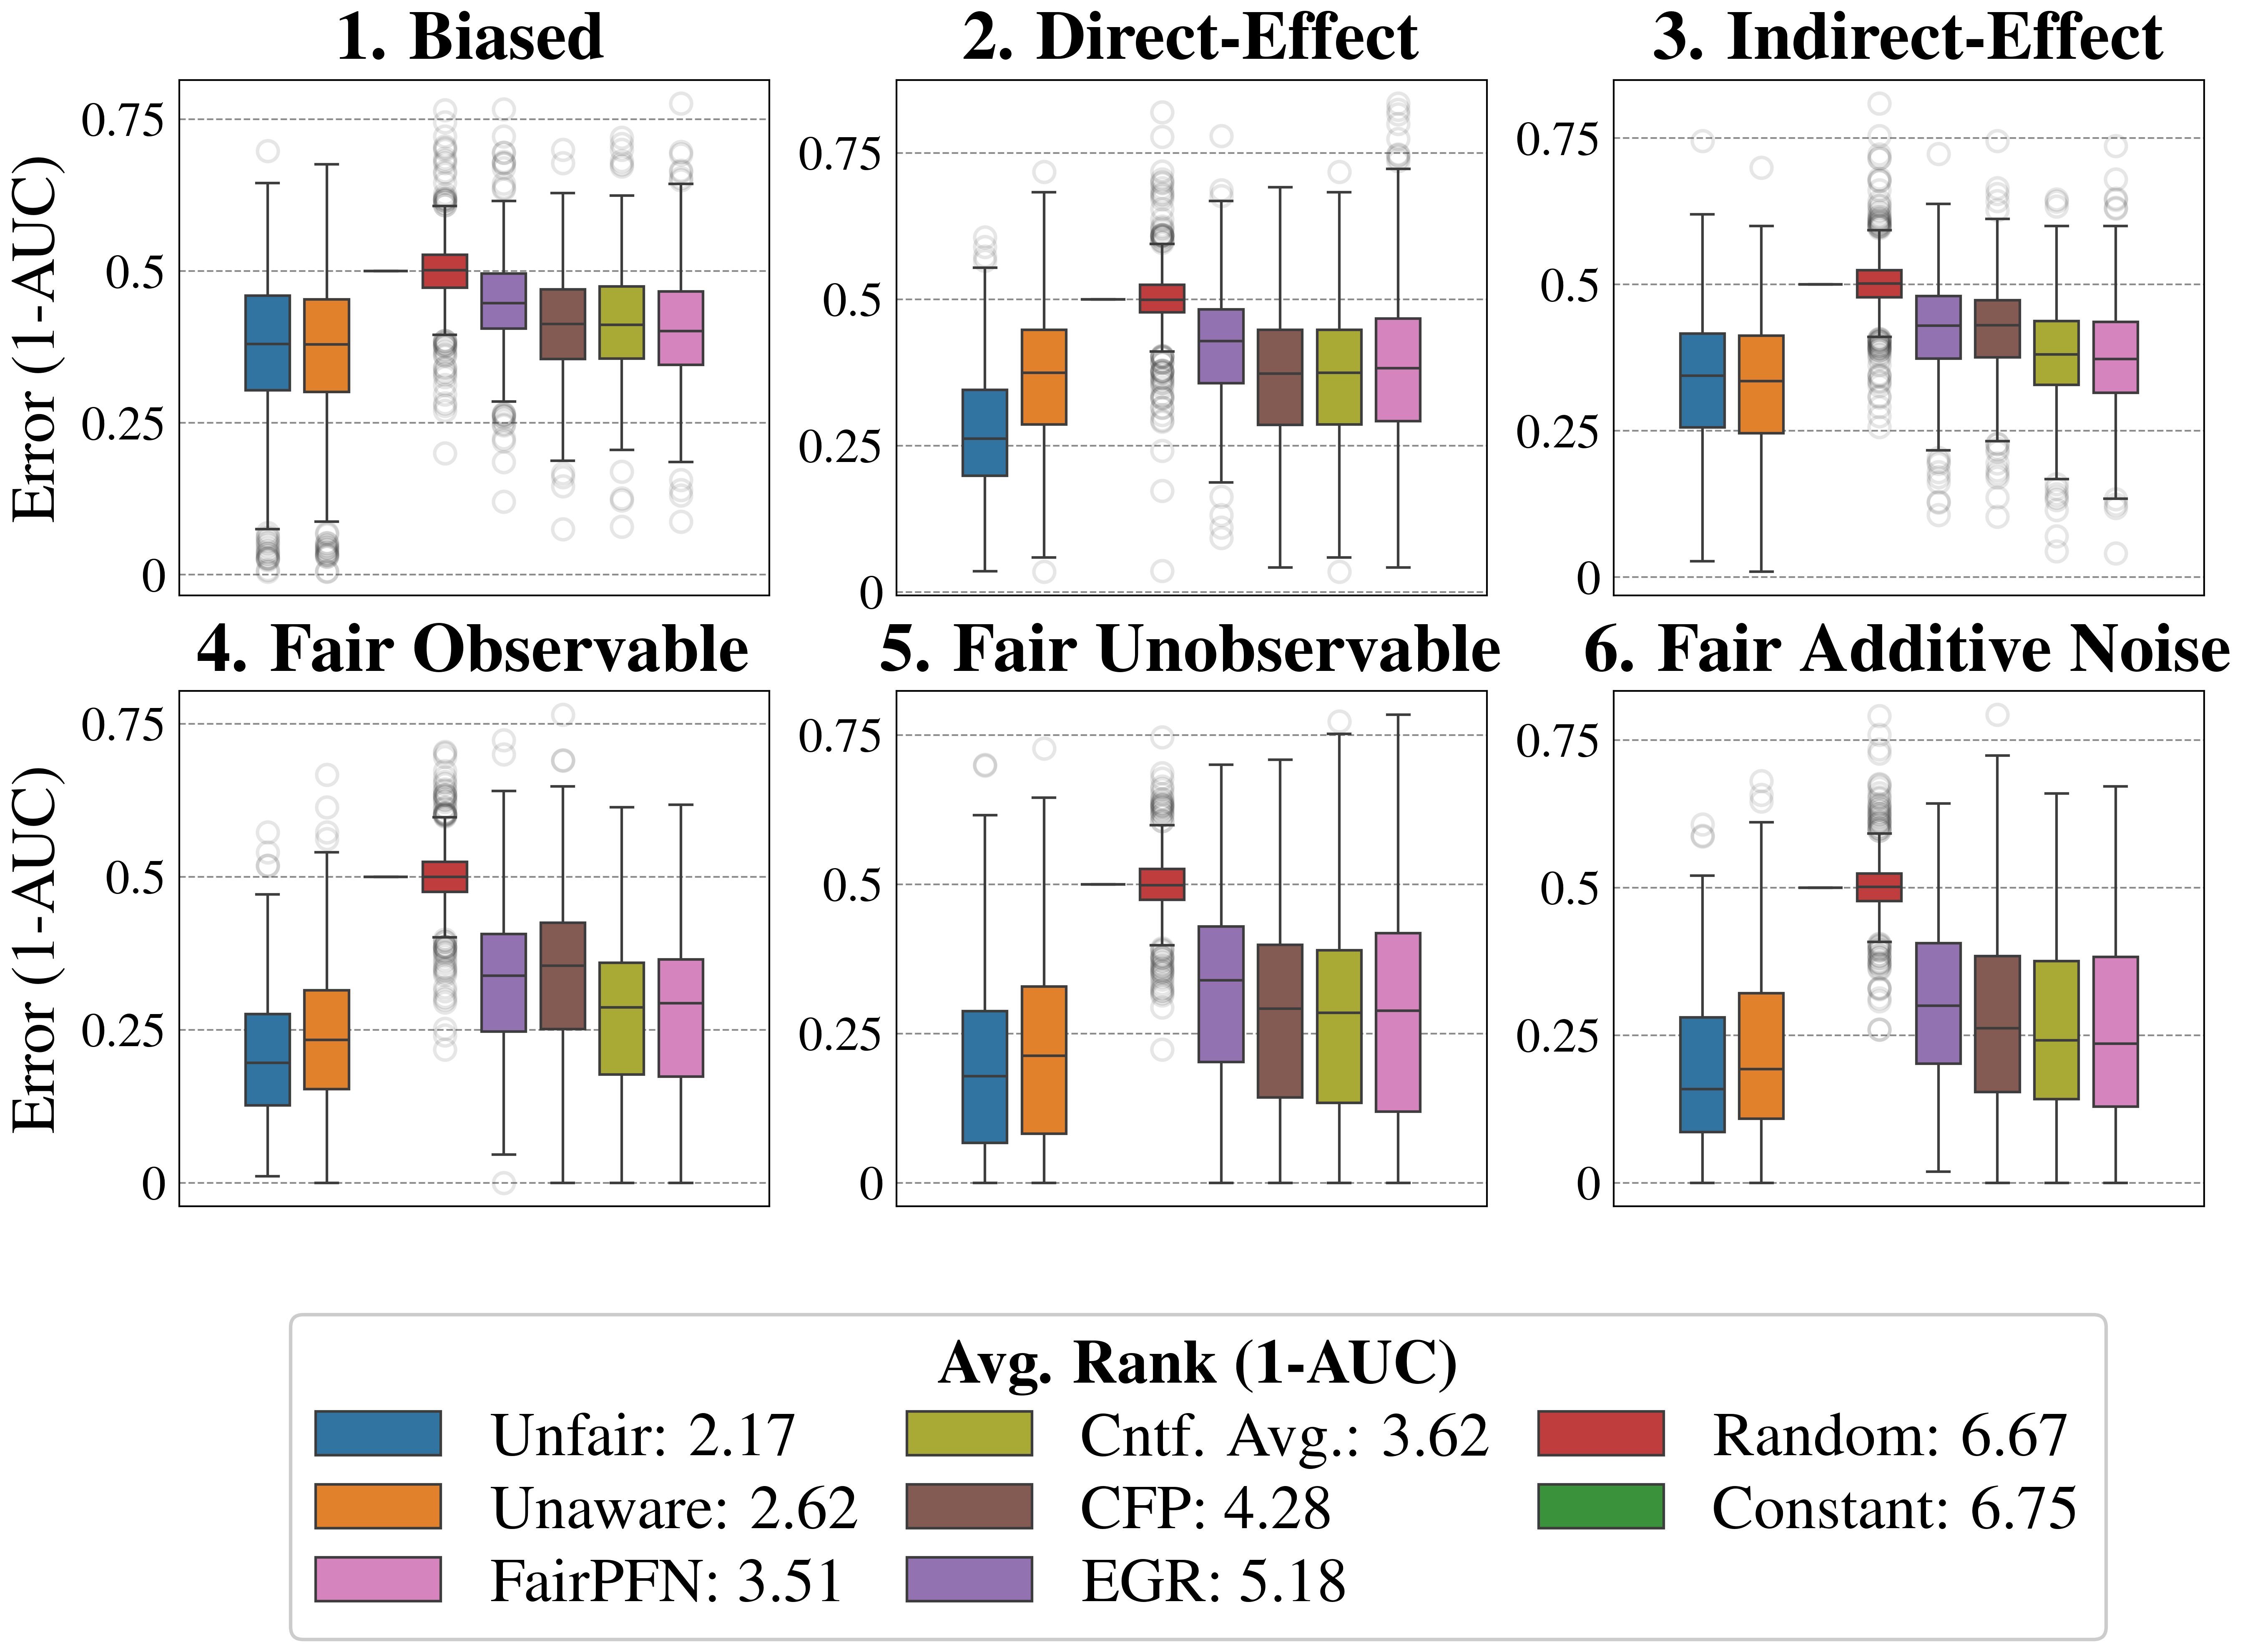
This image presents a 2x3 grid of box plots, each representing the distribution of "Error (1-AUC)" for different fairness interventions under various fairness definitions. The plots compare the performance of several algorithms (Unfair, Unaware, FairPFN, CFP, EGR, Random, Constant) across six different scenarios: Biased, Direct-Effect, Indirect-Effect, Fair Observable, Fair Unobservable, and Fair Additive Noise.
### Components/Axes
* **Y-axis:** "Error (1-AUC)", ranging from approximately 0 to 0.75.
* **X-axis:** Implicitly represents the different algorithms being compared within each scenario.
* **Box Plots:** Each box plot represents the distribution of Error (1-AUC) for a specific algorithm in a specific scenario. The box represents the interquartile range (IQR), the line inside the box represents the median, and the whiskers extend to the minimum and maximum values within 1.5 times the IQR. Outliers are shown as individual points.
* **Legend:** Located at the bottom-right of the image, it maps colors to the following algorithms:
* Unfair (Light Blue): Avg. Rank (1-AUC) = 2.17
* Unaware (Orange): Avg. Rank (1-AUC) = 2.62
* FairPFN (Purple): Avg. Rank (1-AUC) = 3.51
* CFP (Dark Orange): Avg. Rank (1-AUC) = 4.28
* EGR (Violet): Avg. Rank (1-AUC) = 5.18
* Random (Red): Avg. Rank (1-AUC) = 6.67
* Constant (Dark Green): Avg. Rank (1-AUC) = 6.75
* **Titles:** Each subplot is numbered and labeled with a fairness scenario: 1. Biased, 2. Direct-Effect, 3. Indirect-Effect, 4. Fair Observable, 5. Fair Unobservable, 6. Fair Additive Noise.
### Detailed Analysis
Here's a breakdown of the trends and approximate values observed in each subplot:
**1. Biased:**
* Unfair (Light Blue): Median around 0.35, IQR from 0.25 to 0.45.
* Unaware (Orange): Median around 0.4, IQR from 0.3 to 0.5.
* FairPFN (Purple): Median around 0.5, IQR from 0.4 to 0.6.
* CFP (Dark Orange): Median around 0.55, IQR from 0.45 to 0.65.
* EGR (Violet): Median around 0.6, IQR from 0.5 to 0.7.
* Random (Red): Median around 0.5, IQR from 0.4 to 0.6.
* Constant (Dark Green): Median around 0.5, IQR from 0.4 to 0.6.
**2. Direct-Effect:**
* Unfair (Light Blue): Median around 0.3, IQR from 0.2 to 0.4.
* Unaware (Orange): Median around 0.4, IQR from 0.3 to 0.5.
* FairPFN (Purple): Median around 0.5, IQR from 0.4 to 0.6.
* CFP (Dark Orange): Median around 0.55, IQR from 0.45 to 0.65.
* EGR (Violet): Median around 0.6, IQR from 0.5 to 0.7.
* Random (Red): Median around 0.5, IQR from 0.4 to 0.6.
* Constant (Dark Green): Median around 0.5, IQR from 0.4 to 0.6.
**3. Indirect-Effect:**
* Unfair (Light Blue): Median around 0.35, IQR from 0.25 to 0.45.
* Unaware (Orange): Median around 0.4, IQR from 0.3 to 0.5.
* FairPFN (Purple): Median around 0.5, IQR from 0.4 to 0.6.
* CFP (Dark Orange): Median around 0.55, IQR from 0.45 to 0.65.
* EGR (Violet): Median around 0.6, IQR from 0.5 to 0.7.
* Random (Red): Median around 0.5, IQR from 0.4 to 0.6.
* Constant (Dark Green): Median around 0.5, IQR from 0.4 to 0.6.
**4. Fair Observable:**
* Unfair (Light Blue): Median around 0.25, IQR from 0.2 to 0.35.
* Unaware (Orange): Median around 0.3, IQR from 0.2 to 0.4.
* FairPFN (Purple): Median around 0.4, IQR from 0.3 to 0.5.
* CFP (Dark Orange): Median around 0.45, IQR from 0.35 to 0.55.
* EGR (Violet): Median around 0.5, IQR from 0.4 to 0.6.
* Random (Red): Median around 0.45, IQR from 0.35 to 0.55.
* Constant (Dark Green): Median around 0.5, IQR from 0.4 to 0.6.
**5. Fair Unobservable:**
* Unfair (Light Blue): Median around 0.3, IQR from 0.2 to 0.4.
* Unaware (Orange): Median around 0.35, IQR from 0.25 to 0.45.
* FairPFN (Purple): Median around 0.45, IQR from 0.35 to 0.55.
* CFP (Dark Orange): Median around 0.5, IQR from 0.4 to 0.6.
* EGR (Violet): Median around 0.55, IQR from 0.45 to 0.65.
* Random (Red): Median around 0.5, IQR from 0.4 to 0.6.
* Constant (Dark Green): Median around 0.5, IQR from 0.4 to 0.6.
**6. Fair Additive Noise:**
* Unfair (Light Blue): Median around 0.3, IQR from 0.2 to 0.4.
* Unaware (Orange): Median around 0.35, IQR from 0.25 to 0.45.
* FairPFN (Purple): Median around 0.45, IQR from 0.35 to 0.55.
* CFP (Dark Orange): Median around 0.5, IQR from 0.4 to 0.6.
* EGR (Violet): Median around 0.55, IQR from 0.45 to 0.65.
* Random (Red): Median around 0.5, IQR from 0.4 to 0.6.
* Constant (Dark Green): Median around 0.5, IQR from 0.4 to 0.6.
### Key Observations
* The "Unfair" and "Unaware" algorithms generally exhibit lower error rates compared to the fairness-aware algorithms (FairPFN, CFP, EGR) in the "Biased", "Direct-Effect", and "Indirect-Effect" scenarios.
* In the "Fair" scenarios (Observable, Unobservable, Additive Noise), the error rates tend to increase for all algorithms, but the differences between them become less pronounced.
* The "Constant" and "Random" algorithms consistently show similar performance across all scenarios, with median error rates around 0.5.
* The average rank values in the legend indicate that "Unfair" has the lowest average rank (2.17), suggesting it performs best overall, while "Constant" and "Random" have the highest ranks (6.75 and 6.67, respectively).
### Interpretation
The data suggests a trade-off between fairness and accuracy. Algorithms that do not explicitly address fairness ("Unfair" and "Unaware") achieve lower error rates in scenarios where bias is present, but this comes at the cost of potentially perpetuating or exacerbating unfairness. Fairness-aware algorithms (FairPFN, CFP, EGR) generally have higher error rates, but they aim to mitigate bias and promote fairness.
The increased error rates in the "Fair" scenarios indicate that enforcing fairness constraints can lead to a decrease in overall accuracy. This is a common phenomenon in fairness-aware machine learning. The similar performance of the "Constant" and "Random" algorithms suggests that simply adding noise or using a constant prediction does not necessarily improve fairness or accuracy.
The average rank values provide a quantitative measure of the overall performance of each algorithm. The fact that "Unfair" has the lowest average rank highlights the accuracy-fairness trade-off. The choice of which algorithm to use depends on the specific application and the relative importance of accuracy and fairness.
DECODING INTELLIGENCE...