## Line Chart: Attention over Values, a=128
### Overview
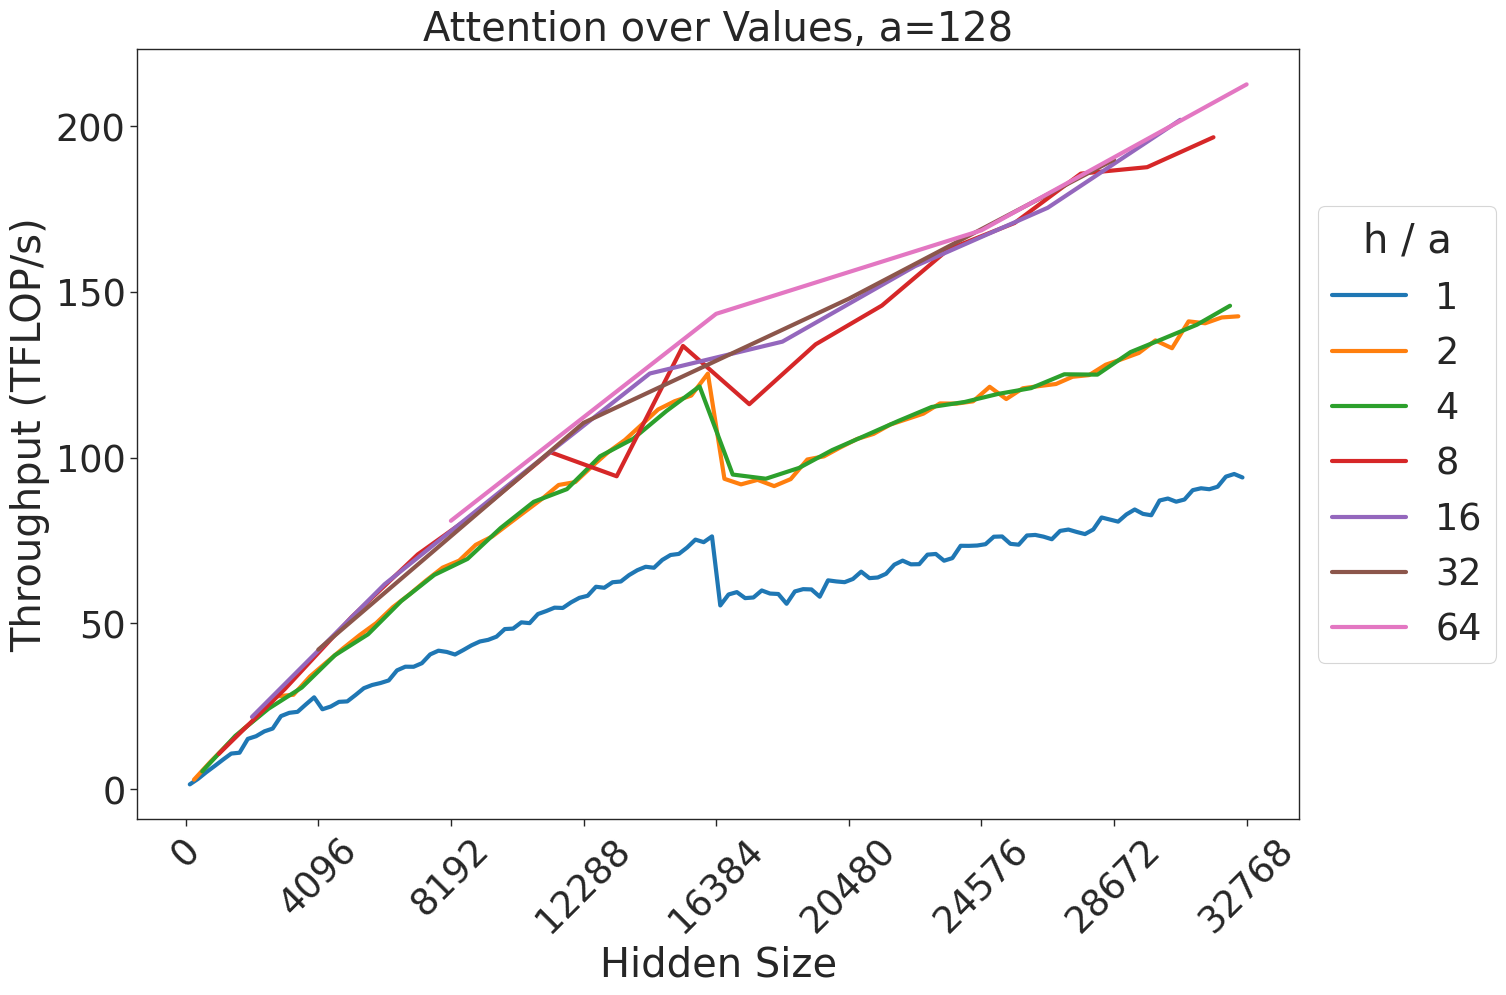
This image displays a performance benchmark chart illustrating the throughput (measured in TFLOP/s) of an attention mechanism relative to the "Hidden Size" of a model. The chart demonstrates how different ratios of heads to attention dimension (`h / a`) affect computational throughput. A critical feature of this chart is a consistent, sharp discontinuity in performance occurring at a Hidden Size of 16384 across all data series.
### Components/Axes
* **Title:** "Attention over Values, a=128" (Top center).
* **X-Axis:** "Hidden Size". The scale is linear, with major ticks at 0, 4096, 8192, 12288, 16384, 20480, 24576, 28672, and 32768.
* **Y-Axis:** "Throughput (TFLOP/s)". The scale is linear, with major ticks at 0, 50, 100, 150, and 200.
* **Legend:** Positioned on the right-center. It defines the `h / a` ratio (heads divided by attention dimension) using color-coded lines:
* **Blue:** 1
* **Orange:** 2
* **Green:** 4
* **Red:** 8
* **Purple:** 16
* **Brown:** 32
* **Pink:** 64
### Detailed Analysis
The chart plots seven distinct data series. All series exhibit a general upward trend, indicating that throughput increases as the Hidden Size increases, until the discontinuity at 16384.
**Trend Verification and Data Points:**
* **Blue (h/a = 1):** The lowest performing series. It slopes upward steadily from 0 to ~75 TFLOP/s at x=16384. At 16384, it drops sharply to ~55 TFLOP/s, then resumes a slow upward trend, ending near 95 TFLOP/s at x=32768.
* **Orange (h/a = 2) & Green (h/a = 4):** These two lines are nearly identical and overlap significantly. They slope upward to ~125 TFLOP/s at x=16384. At 16384, they drop sharply to ~95 TFLOP/s, then resume an upward trend, ending near 145 TFLOP/s at x=32768.
* **Red (h/a = 8):** This line slopes upward to ~135 TFLOP/s at x=16384. It experiences a sharp drop to ~115 TFLOP/s, then continues an upward trend, ending near 200 TFLOP/s at x=32768.
* **Purple (h/a = 16) & Brown (h/a = 32):** These two lines are nearly identical and overlap significantly. They slope upward to ~130 TFLOP/s at x=16384. They experience a minor drop to ~125 TFLOP/s, then continue a strong upward trend, ending near 190 TFLOP/s at x=32768.
* **Pink (h/a = 64):** The highest performing series. It slopes upward to ~140 TFLOP/s at x=16384. It shows the least significant drop at 16384 (appearing almost as a plateau or slight dip), then continues a strong upward trend, ending at the highest point on the chart, approximately 215 TFLOP/s at x=32768.
### Key Observations
1. **The 16384 Discontinuity:** Every single data series experiences a performance drop at exactly 16384 on the x-axis. This suggests a hardware or software architectural boundary (e.g., a cache limit, memory tiling threshold, or kernel switch) that triggers a less efficient execution path once the Hidden Size exceeds this value.
2. **Performance Clustering:** The data series cluster into groups. The `h/a` ratios of 2 and 4 perform similarly, as do 16 and 32.
3. **Efficiency Scaling:** Higher `h/a` ratios generally yield higher throughput. The pink line (h/a=64) consistently outperforms the others, while the blue line (h/a=1) is significantly less efficient.
4. **Drop Magnitude:** The magnitude of the performance drop at 16384 is inversely proportional to the `h/a` ratio. The lower the `h/a` ratio (e.g., Blue/1), the more severe the percentage drop in throughput.
### Interpretation
The data demonstrates that throughput in this attention mechanism is highly sensitive to the "Hidden Size" parameter, specifically regarding memory or compute tiling boundaries. The sharp drop at 16384 is a classic indicator of a "cliff" in performance, likely caused by the system switching from a highly optimized kernel (which fits within a specific cache or register limit) to a more generalized, slower kernel when the hidden size exceeds 16384.
The fact that higher `h/a` ratios (64) maintain higher throughput and suffer less from the 16384 boundary suggests that higher head counts allow for better parallelization or more efficient memory access patterns that are less impacted by the specific bottleneck occurring at 16384. This chart would be critical for an engineer optimizing model architecture, as it identifies a "sweet spot" or a "danger zone" for hidden size configuration.