## Heatmap: F1 Score Analysis of Transformer Models
### Overview
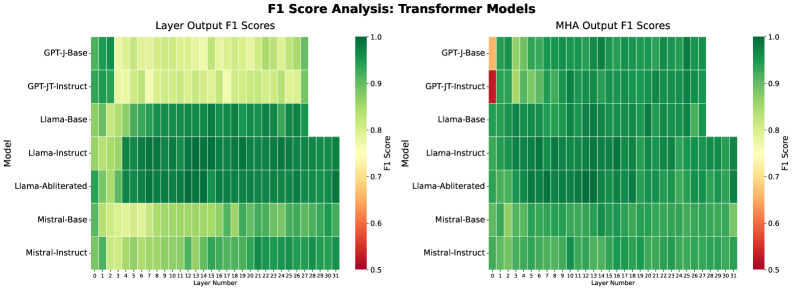
The image presents two side-by-side heatmaps comparing F1 scores of transformer models across different layers. The left heatmap shows "Layer Output F1 Scores," while the right heatmap displays "MHA Output F1 Scores." Models are listed on the y-axis, and layer numbers (0–31) are on the x-axis. Color intensity represents F1 scores, with red (0.5) indicating low performance and green (1.0) indicating high performance.
---
### Components/Axes
- **Y-Axis (Models)**:
- GPT-J-Base
- GPT-JT-Instruct
- Llama-Base
- Llama-Instruct
- Llama-Abliterated
- Mistral-Base
- Mistral-Instruct
- **X-Axis (Layer Numbers)**:
- Layer 0 to Layer 31 (32 layers total).
- **Color Legend**:
- Red (0.5): Low F1 score
- Green (1.0): High F1 score
- Gradient from red to green indicates intermediate scores.
- **Legend Position**:
- Right side of each heatmap, vertically aligned with the y-axis.
---
### Detailed Analysis
#### Layer Output F1 Scores (Left Heatmap)
- **GPT-J-Base**:
- Light green to yellow gradient across layers 0–31, indicating moderate F1 scores (~0.7–0.85).
- **GPT-JT-Instruct**:
- Similar gradient to GPT-J-Base but slightly darker in later layers (~0.75–0.9).
- **Llama-Base**:
- Dark green in layers 10–31 (~0.85–0.95), lighter in early layers (~0.7–0.8).
- **Llama-Instruct**:
- Consistently dark green across all layers (~0.9–1.0).
- **Llama-Abliterated**:
- Dark green in layers 10–31 (~0.85–0.95), lighter in early layers (~0.7–0.8).
- **Mistral-Base**:
- Light green to yellow gradient (~0.7–0.85).
- **Mistral-Instruct**:
- Consistently dark green (~0.9–1.0).
#### MHA Output F1 Scores (Right Heatmap)
- **GPT-J-Base**:
- Light green to yellow gradient (~0.7–0.85).
- **GPT-JT-Instruct**:
- Dark green in most layers (~0.85–0.95), but **red in Layer 0** (~0.5), a notable outlier.
- **Llama-Base**:
- Dark green in layers 10–31 (~0.85–0.95), lighter in early layers (~0.7–0.8).
- **Llama-Instruct**:
- Consistently dark green (~0.9–1.0).
- **Llama-Abliterated**:
- Dark green in layers 10–31 (~0.85–0.95), lighter in early layers (~0.7–0.8).
- **Mistral-Base**:
- Light green to yellow gradient (~0.7–0.85).
- **Mistral-Instruct**:
- Consistently dark green (~0.9–1.0).
---
### Key Observations
1. **Mistral-Instruct** and **Llama-Instruct** consistently achieve the highest F1 scores (~0.9–1.0) across all layers in both heatmaps.
2. **GPT-JT-Instruct** shows a significant outlier in **MHA Output Layer 0** (red, ~0.5), contrasting with its otherwise strong performance.
3. **Llama-Abliterated** and **Llama-Base** exhibit similar trends, with improved performance in later layers.
4. **GPT-J-Base** and **Mistral-Base** have lower scores in early layers but improve gradually.
---
### Interpretation
- **Model Architecture Impact**:
- Instruct-tuned variants (e.g., Llama-Instruct, Mistral-Instruct) outperform base models, suggesting instruction fine-tuning enhances layer-wise performance.
- **MHA Layer Dynamics**:
- The red cell in GPT-JT-Instruct’s MHA Layer 0 indicates a potential architectural weakness or training instability in early attention mechanisms.
- **Layer Depth Trends**:
- Most models show improved F1 scores in deeper layers, implying that later layers capture more complex patterns.
- **Anomaly Investigation**:
- The outlier in GPT-JT-Instruct’s MHA Layer 0 warrants further analysis to determine if it reflects a bug, data artifact, or intentional design choice.
This analysis highlights the importance of model architecture and training strategies in determining layer-wise performance, with instruct-tuned models demonstrating superior consistency.