## Pie Charts: Error Distribution Across AI Models (Search Only w/o Demo)
### Overview
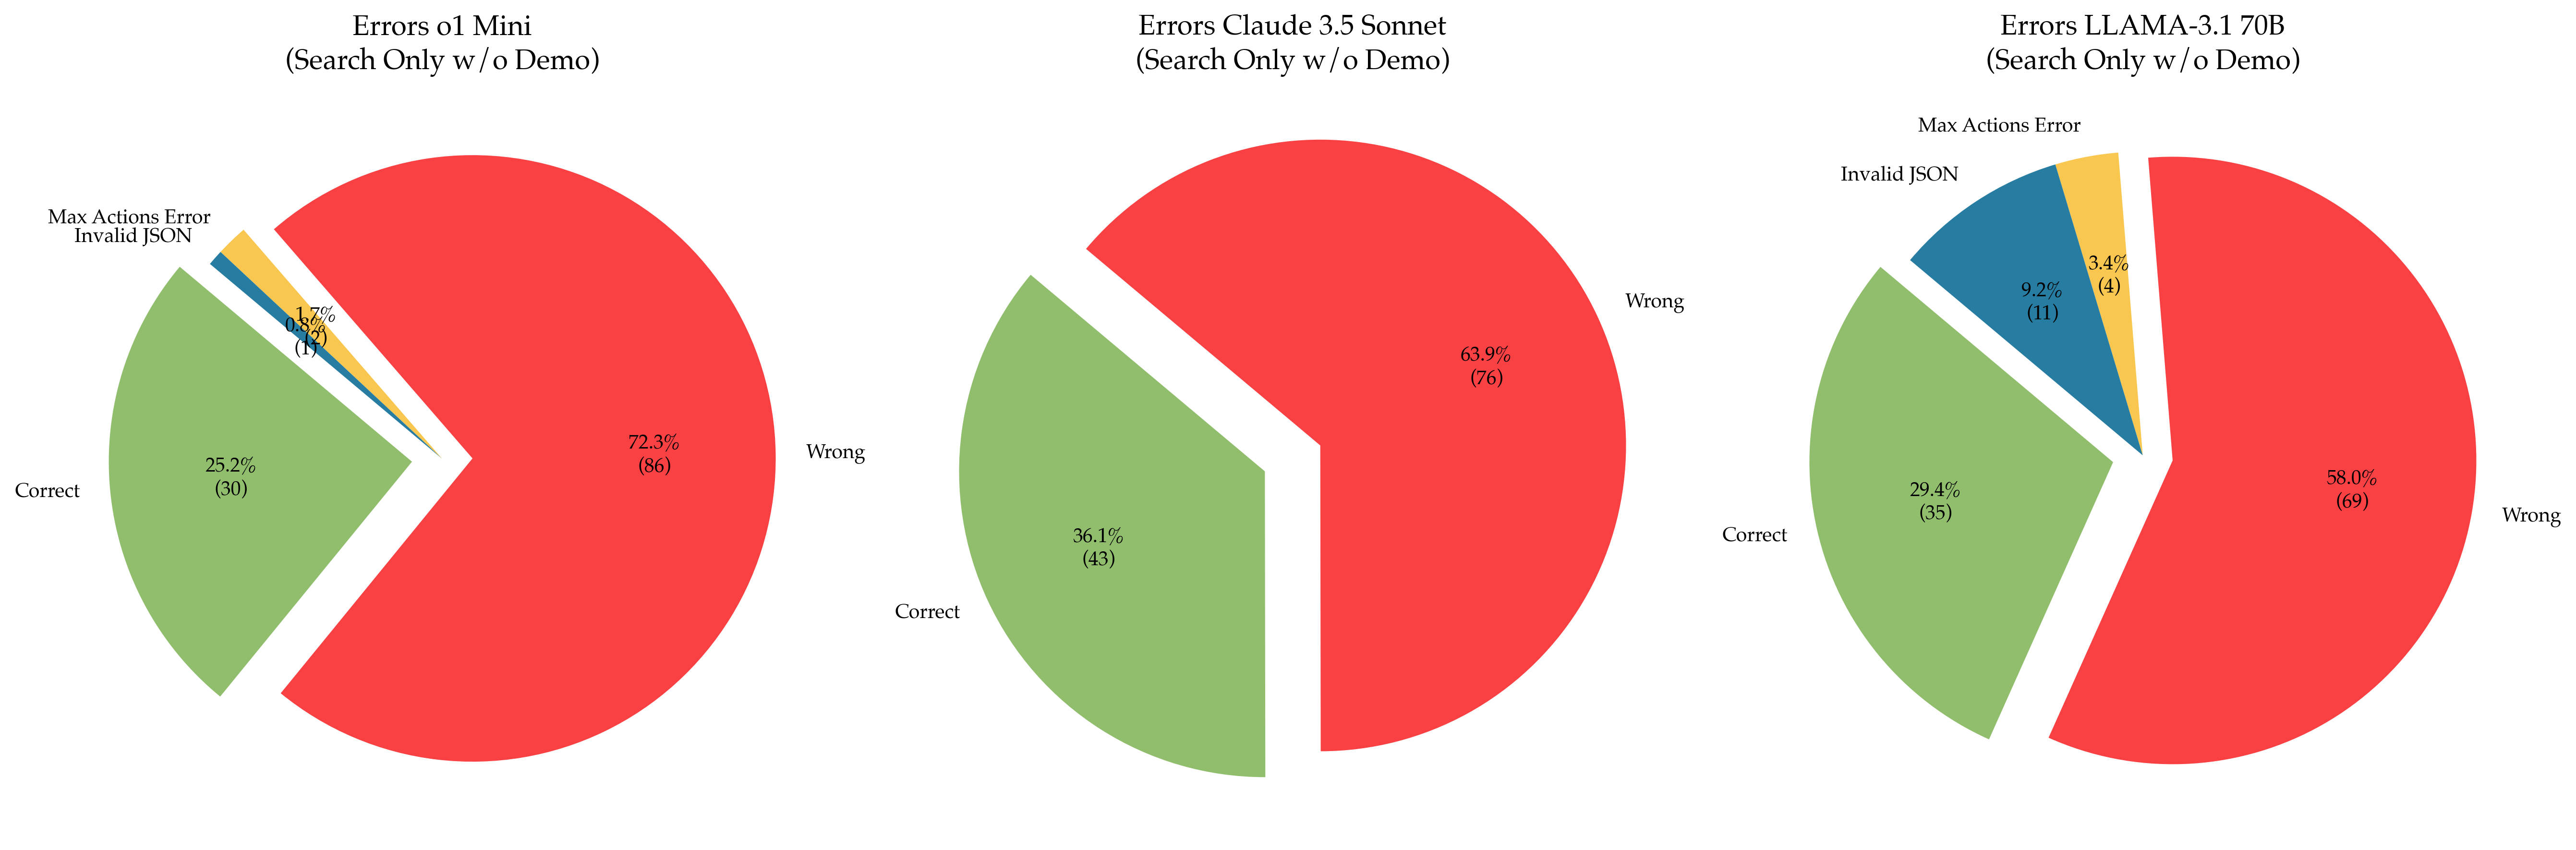
The image contains three pie charts comparing error distributions for three AI models:
1. **Errors o1 Mini**
2. **Errors Claude 3.5 Sonnet**
3. **Errors LLAMA-3.1 70B**
Each chart categorizes errors into:
- **Correct** (green)
- **Wrong** (red)
- **Max Actions Error** (yellow)
- **Invalid JSON** (blue)
Percentages and absolute counts are provided for each category.
---
### Components/Axes
- **Legend**: Located on the right side of each chart, mapping colors to error types:
- Red = Wrong
- Green = Correct
- Yellow = Max Actions Error
- Blue = Invalid JSON
- **Slices**: Ordered clockwise starting with **Correct** (green), followed by **Wrong** (red), **Max Actions Error** (yellow), and **Invalid JSON** (blue) in the first two charts. The third chart reorders slices as **Correct**, **Wrong**, **Invalid JSON**, **Max Actions Error**.
- **Text Annotations**: Percentages (e.g., 72.3%) and counts (e.g., 86) are displayed inside each slice.
---
### Detailed Analysis
#### 1. **Errors o1 Mini**
- **Wrong**: 72.3% (86)
- **Correct**: 25.2% (30)
- **Max Actions Error**: 1.7% (2)
- **Invalid JSON**: 0.8% (1)
#### 2. **Errors Claude 3.5 Sonnet**
- **Wrong**: 63.9% (76)
- **Correct**: 30.0% (43)
- **Max Actions Error**: 3.4% (5)
- **Invalid JSON**: 2.7% (4)
#### 3. **Errors LLAMA-3.1 70B**
- **Wrong**: 58.0% (69)
- **Correct**: 36.1% (43)
- **Invalid JSON**: 9.2% (11)
- **Max Actions Error**: 3.4% (4)
---
### Key Observations
1. **Error Severity**:
- **o1 Mini** has the highest **Wrong** errors (72.3%) and the lowest **Invalid JSON** (0.8%).
- **LLAMA-3.1 70B** has the lowest **Wrong** errors (58.0%) and the highest **Correct** (36.1%).
- **Claude 3.5 Sonnet** falls between the two, with 63.9% **Wrong** and 30.0% **Correct**.
2. **Invalid JSON Errors**:
- **LLAMA-3.1 70B** has the highest **Invalid JSON** (9.2%), suggesting potential issues with input parsing or schema validation.
- **o1 Mini** has the lowest **Invalid JSON** (0.8%), indicating robust input handling.
3. **Max Actions Error**:
- Consistent at **3.4%** (4–5 counts) across **Claude 3.5 Sonnet** and **LLAMA-3.1 70B**, but lower in **o1 Mini** (1.7%, 2 counts).
---
### Interpretation
- **Model Performance**:
- **LLAMA-3.1 70B** demonstrates the best overall accuracy (lowest **Wrong**, highest **Correct**), suggesting superior training or architecture.
- **o1 Mini** struggles with correctness, potentially due to simpler design or limited training data.
- **Claude 3.5 Sonnet** balances performance but lags behind LLAMA-3.1.
- **Error Patterns**:
- **Invalid JSON** errors are most prevalent in **LLAMA-3.1 70B**, which may indicate stricter input requirements or sensitivity to malformed queries.
- **Max Actions Error** is rare across all models, implying efficient resource management.
- **Implications**:
- **LLAMA-3.1 70B** is the most reliable for search tasks without a demo.
- **o1 Mini** may require optimization to reduce **Wrong** errors.
- High **Invalid JSON** in LLAMA-3.1 could signal a need for input validation improvements.
---
### Spatial Grounding & Color Verification
- **Legend Position**: Right-aligned in all charts.
- **Color Consistency**:
- Red slices (Wrong) are largest in all charts.
- Green (Correct) varies but is largest in LLAMA-3.1.
- Yellow (Max Actions Error) and blue (Invalid JSON) are smallest, with blue largest in LLAMA-3.1.
---
### Trends Verification
- **o1 Mini**: Dominated by **Wrong** errors (72.3%), with minimal **Invalid JSON** (0.8%).
- **Claude 3.5 Sonnet**: Balanced but error-prone, with **Wrong** at 63.9%.
- **LLAMA-3.1 70B**: Most accurate, with **Wrong** at 58.0% and **Correct** at 36.1%.
---
### Conclusion
The data highlights significant performance disparities between models, with **LLAMA-3.1 70B** outperforming others in accuracy. Error types like **Invalid JSON** and **Max Actions Error** provide insights into model limitations, guiding targeted improvements.