## Diagram: APTPU Generation Process
### Overview
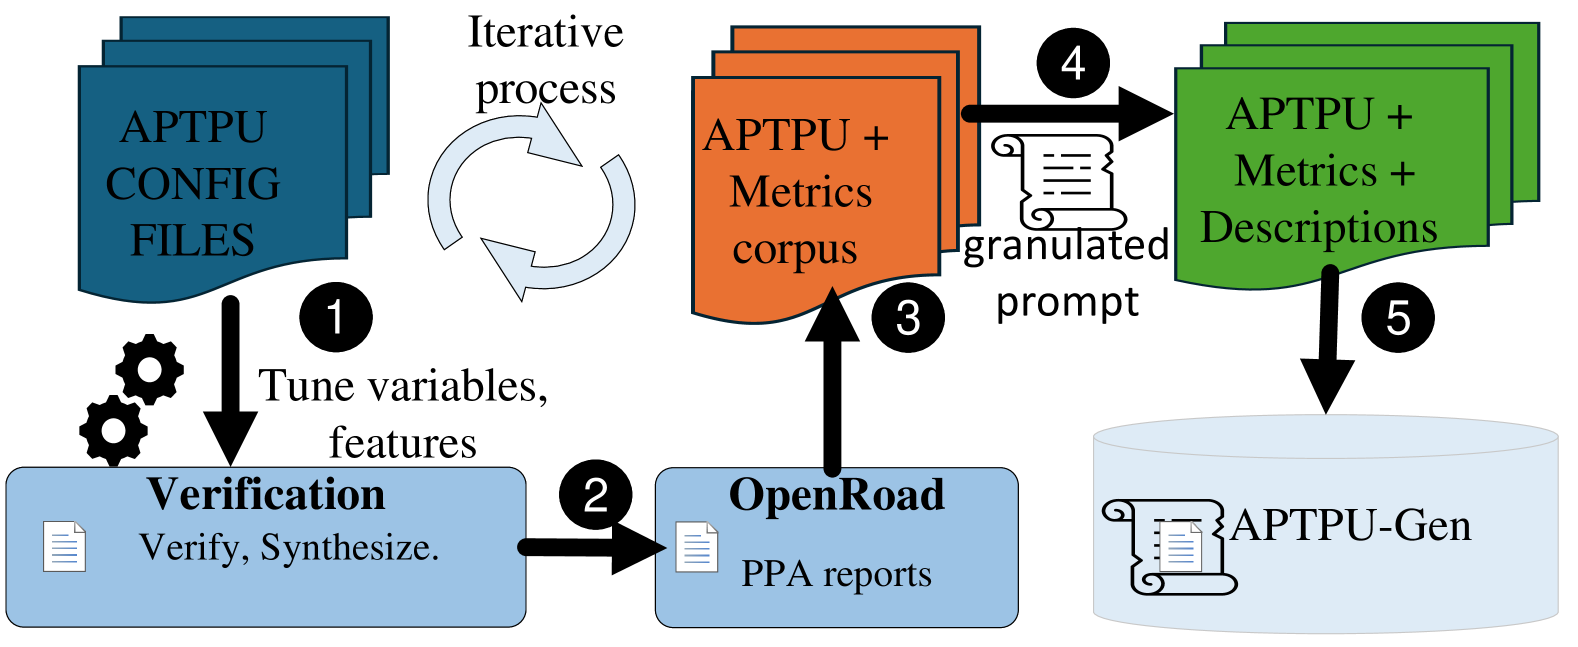
The image is a diagram illustrating the process of generating APTPU (presumably an acronym for a system or tool) configurations. The diagram shows a series of steps, starting from configuration files, moving through verification and OpenRoad, and culminating in the generation of APTPU-Gen. The process involves iterative refinement and the incorporation of metrics and descriptions.
### Components/Axes
The diagram consists of the following key components:
1. **APTPU CONFIG FILES:** Represented by a stack of blue documents.
2. **Verification:** A light blue box containing the text "Verification" and "Verify, Synthesize."
3. **OpenRoad:** A light blue box containing the text "OpenRoad" and "PPA reports."
4. **APTPU + Metrics corpus:** Represented by a stack of orange documents.
5. **granulated prompt:** Represented by a scroll icon.
6. **APTPU + Metrics + Descriptions:** Represented by a stack of green documents.
7. **APTPU-Gen:** Represented by a light blue cylinder (database) with a scroll icon.
8. **Arrows:** Black arrows indicate the flow of the process. A pair of curved white arrows indicates an iterative process.
9. **Numbers:** Black circles containing white numbers (1-5) indicate the sequence of steps.
### Detailed Analysis
* **Step 1:** APTPU CONFIG FILES (blue) flow downward to a process involving gears and the text "Tune variables, features." This leads to the "Verification" box (light blue) containing the text "Verify, Synthesize."
* **Step 2:** The "Verification" box (light blue) flows rightward to the "OpenRoad" box (light blue) containing the text "PPA reports."
* **Step 3:** The "OpenRoad" box (light blue) flows upward to the "APTPU + Metrics corpus" (orange).
* **Iterative Process:** A pair of curved white arrows indicates an iterative process between the "APTPU + Metrics corpus" (orange) and the "Tune variables, features" step.
* **Step 4:** The "APTPU + Metrics corpus" (orange) flows rightward, combined with a "granulated prompt" (scroll icon), to "APTPU + Metrics + Descriptions" (green).
* **Step 5:** The "APTPU + Metrics + Descriptions" (green) flows downward to the "APTPU-Gen" database (light blue cylinder).
### Key Observations
* The process starts with configuration files and involves iterative tuning and verification.
* Metrics and descriptions are added to the APTPU data as the process progresses.
* The final output is stored in an "APTPU-Gen" database.
### Interpretation
The diagram illustrates a systematic process for generating APTPU configurations. The iterative nature of the process suggests that the configurations are refined over time, likely based on performance metrics and other feedback. The addition of metrics and descriptions indicates an effort to improve the quality and usability of the generated configurations. The use of OpenRoad suggests that the process is related to physical design automation (PDA) or electronic design automation (EDA). The "granulated prompt" suggests that the process may involve some form of automated prompt generation or refinement.