\n
## Diagram: Neural Network Architecture for Spin Configuration
### Overview
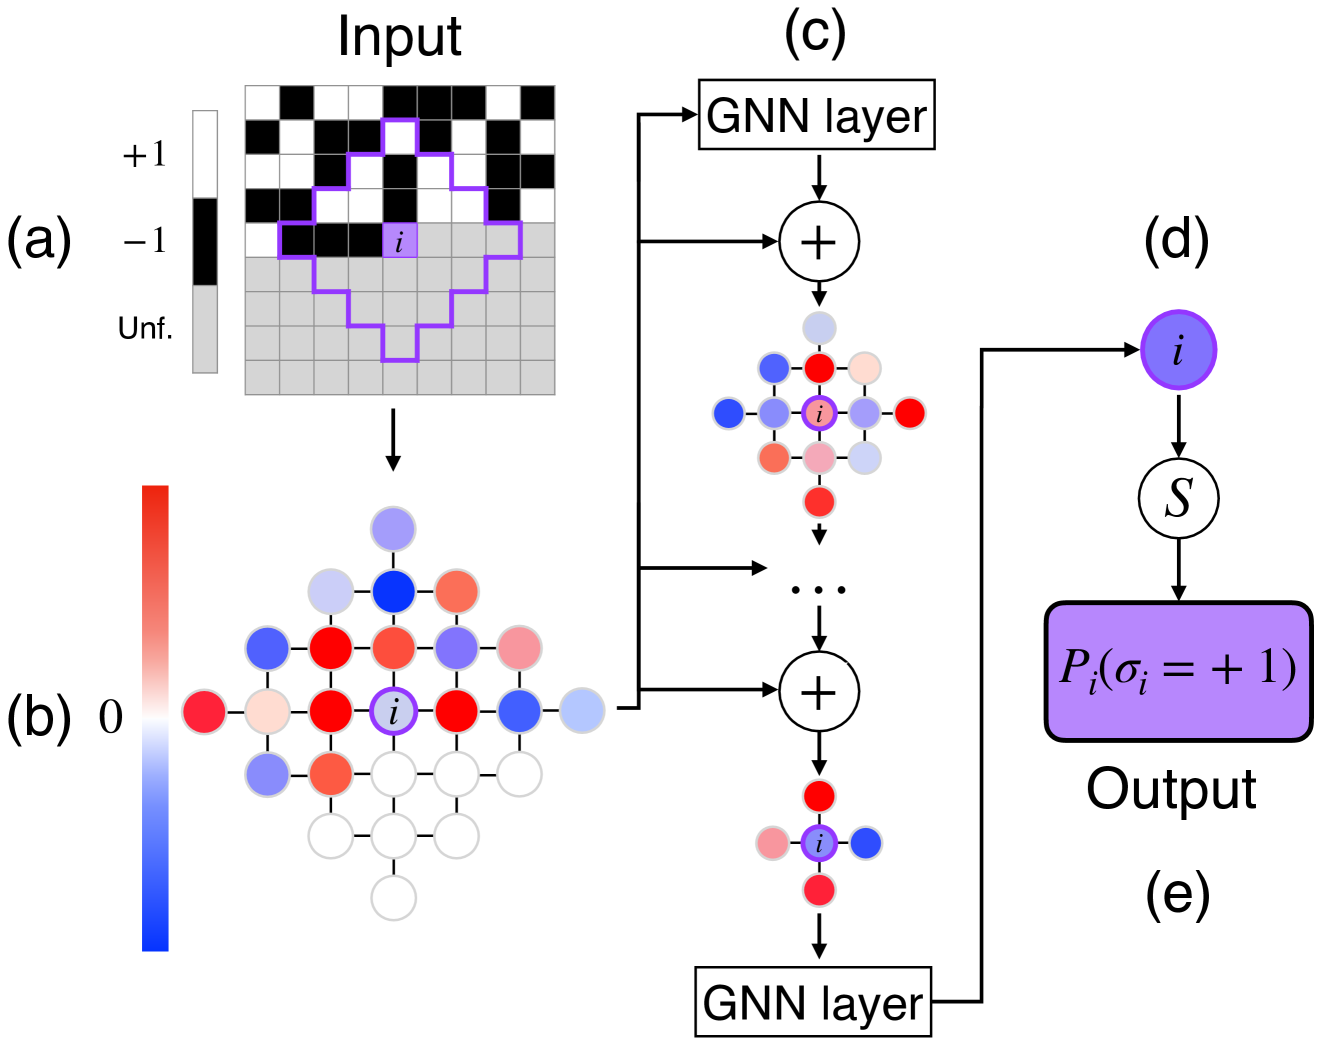
This diagram illustrates the architecture of a neural network designed to process spin configurations. The network takes an input representing a spin lattice, processes it through Graph Neural Network (GNN) layers, and outputs a prediction about the spin state of a specific site 'i'. The diagram is segmented into input, intermediate processing stages, and output.
### Components/Axes
The diagram is labeled with the following components:
* **(a) Input:** Represents the initial spin configuration. The color scale indicates spin values: +1 (red), -1 (black), and Unf. (unfilled/white).
* **(b) Color Scale:** A gradient from red to blue, representing values from +1 to -1, with 0 in the middle.
* **(c) GNN layer:** Indicates a Graph Neural Network layer. There are two GNN layers shown.
* **(d) Node 'i':** Represents a specific spin site being analyzed.
* **(e) Output:** The final prediction of the spin state of site 'i'.
* **'+' symbol:** Represents a summation operation.
* **'S' symbol:** Represents a sigmoid function.
* **Pᵢ(σᵢ = +1):** The probability that spin 'i' is +1.
### Detailed Analysis or Content Details
The input (a) is a grid of squares, colored in red, black, and white. The red squares represent spin +1, black squares represent spin -1, and white squares represent an undefined or unfilled state. A highlighted square labeled 'i' is present within the input grid.
The input is fed into a GNN layer (c). The output of this layer is a set of nodes, colored red and blue, connected by lines. The node 'i' is highlighted in purple. The nodes are then fed into summation operations ('+') and subsequently into another GNN layer. This process is repeated multiple times, as indicated by the ellipsis ("...").
The final output (e) is a single node representing the prediction for spin 'i'. The output is associated with the equation Pᵢ(σᵢ = +1), which represents the probability that the spin at site 'i' is +1.
The nodes in the intermediate layers are colored based on their value, with red indicating a positive value and blue indicating a negative value. The intensity of the color likely corresponds to the magnitude of the value. The connections between nodes represent the graph structure used by the GNN.
### Key Observations
* The network architecture involves multiple GNN layers, suggesting a deep learning approach.
* The summation operations likely aggregate information from neighboring nodes in the graph.
* The sigmoid function 'S' is used to map the output of the network to a probability between 0 and 1.
* The input spin configuration is represented as a grid, which is then transformed into a graph structure for processing by the GNN.
* The network focuses on predicting the spin state of a single site 'i', suggesting a task of spin state classification or prediction.
### Interpretation
This diagram depicts a neural network designed to learn the relationships between spin configurations and the resulting spin state of a particular site. The use of GNNs is appropriate because spin systems naturally exhibit graph-like structures, where spins interact with their neighbors. The network learns to extract features from the input spin configuration and use them to predict the spin state of the target site 'i'. The output probability Pᵢ(σᵢ = +1) provides a measure of confidence in the prediction. The repeated GNN layers suggest that the network is capable of capturing complex interactions between spins. The diagram does not provide specific data or numerical values, but rather illustrates the overall architecture and flow of information within the network. The diagram suggests a model for solving the Ising model or similar spin-based problems. The network is designed to learn the correlations between spins and predict the state of a given spin based on its environment.