\n
## Chart: Critical Batch Size vs. Performance
### Overview
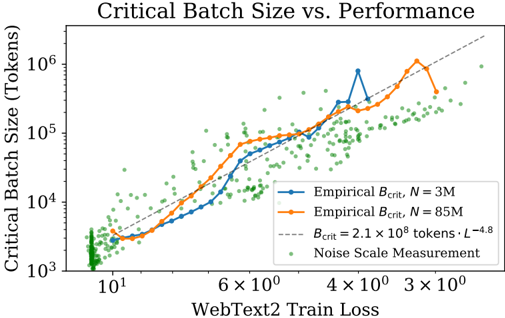
The image presents a chart illustrating the relationship between Critical Batch Size (in tokens) and WebText2 Train Loss. The chart displays two empirical curves representing different dataset sizes (N = 3M and N = 85M), a theoretical curve, and a scatter plot representing noise scale measurements. The chart aims to demonstrate how critical batch size scales with training loss and dataset size.
### Components/Axes
* **Title:** "Critical Batch Size vs. Performance" (Top-center)
* **X-axis:** "WebText2 Train Loss" (Bottom-center). Scale is logarithmic, with markers at 10<sup>1</sup>, 6 x 10<sup>0</sup>, 4 x 10<sup>0</sup>, 3 x 10<sup>0</sup>.
* **Y-axis:** "Critical Batch Size (Tokens)" (Left-center). Scale is logarithmic, with markers at 10<sup>3</sup>, 10<sup>4</sup>, 10<sup>5</sup>, 10<sup>6</sup>.
* **Legend:** Located in the top-right corner.
* "Empirical B<sub>crit</sub>, N = 3M" (Solid blue line)
* "Empirical B<sub>crit</sub>, N = 85M" (Solid orange line)
* "B<sub>crit</sub> = 2.1 x 10<sup>8</sup> tokens · L<sup>-4.8</sup>" (Gray dashed line)
* "Noise Scale Measurement" (Green dotted points)
### Detailed Analysis
The chart displays the following data:
* **Empirical B<sub>crit</sub>, N = 3M (Blue Line):** This line shows an upward trend, initially steep, then leveling off.
* At WebText2 Train Loss ≈ 10<sup>1</sup>, Critical Batch Size ≈ 2 x 10<sup>3</sup> tokens.
* At WebText2 Train Loss ≈ 6 x 10<sup>0</sup>, Critical Batch Size ≈ 1 x 10<sup>4</sup> tokens.
* At WebText2 Train Loss ≈ 4 x 10<sup>0</sup>, Critical Batch Size ≈ 3 x 10<sup>4</sup> tokens.
* At WebText2 Train Loss ≈ 3 x 10<sup>0</sup>, Critical Batch Size ≈ 5 x 10<sup>4</sup> tokens.
* There is a peak around WebText2 Train Loss ≈ 2 x 10<sup>0</sup>, with Critical Batch Size ≈ 8 x 10<sup>4</sup> tokens.
* **Empirical B<sub>crit</sub>, N = 85M (Orange Line):** This line also shows an upward trend, but it is generally higher than the blue line.
* At WebText2 Train Loss ≈ 10<sup>1</sup>, Critical Batch Size ≈ 5 x 10<sup>3</sup> tokens.
* At WebText2 Train Loss ≈ 6 x 10<sup>0</sup>, Critical Batch Size ≈ 2 x 10<sup>4</sup> tokens.
* At WebText2 Train Loss ≈ 4 x 10<sup>0</sup>, Critical Batch Size ≈ 6 x 10<sup>4</sup> tokens.
* At WebText2 Train Loss ≈ 3 x 10<sup>0</sup>, Critical Batch Size ≈ 1 x 10<sup>6</sup> tokens.
* **B<sub>crit</sub> = 2.1 x 10<sup>8</sup> tokens · L<sup>-4.8</sup> (Gray Dashed Line):** This line represents a theoretical relationship. It shows a generally upward trend, but is less sensitive to the loss values than the empirical lines.
* At WebText2 Train Loss ≈ 10<sup>1</sup>, Critical Batch Size ≈ 2 x 10<sup>4</sup> tokens.
* At WebText2 Train Loss ≈ 6 x 10<sup>0</sup>, Critical Batch Size ≈ 4 x 10<sup>4</sup> tokens.
* At WebText2 Train Loss ≈ 4 x 10<sup>0</sup>, Critical Batch Size ≈ 6 x 10<sup>4</sup> tokens.
* At WebText2 Train Loss ≈ 3 x 10<sup>0</sup>, Critical Batch Size ≈ 8 x 10<sup>4</sup> tokens.
* **Noise Scale Measurement (Green Points):** These points are scattered throughout the chart, generally concentrated at lower loss values and lower batch sizes. They appear to represent the inherent noise in the system.
### Key Observations
* The critical batch size increases with decreasing WebText2 Train Loss for both empirical curves.
* The 85M dataset (orange line) requires a larger critical batch size than the 3M dataset (blue line) for the same level of training loss.
* The empirical curves deviate from the theoretical curve, particularly at lower loss values.
* The noise scale measurements are relatively consistent across the range of loss values, but they are more densely populated at lower loss values.
### Interpretation
The chart demonstrates the relationship between critical batch size, training loss, and dataset size. The increasing trend of critical batch size with decreasing loss suggests that as the model learns (loss decreases), a larger batch size is needed to maintain stability and prevent divergence. The difference between the two empirical curves highlights the impact of dataset size on the optimal batch size. Larger datasets generally require larger batch sizes. The deviation between the empirical curves and the theoretical curve suggests that the theoretical model may not fully capture the complexities of the training process. The noise scale measurements provide insight into the inherent variability of the system, which can influence the optimal batch size. The chart suggests that choosing an appropriate batch size is crucial for effective training, and that the optimal batch size depends on both the dataset size and the current training loss. The logarithmic scales suggest that the relationship is not linear, and that small changes in loss can have a significant impact on the required batch size.