\n
## Line Chart: Error Estimation Comparison
### Overview
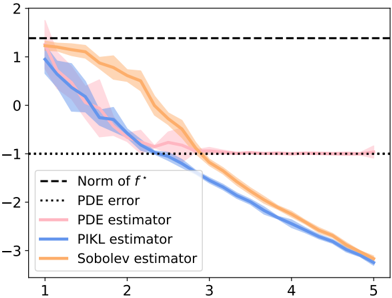
The image presents a line chart comparing the performance of different error estimators (PDE estimator, PIKL estimator, and Sobolev estimator) against the norm of f* and the PDE error. The chart displays the estimators' values across a range of values from approximately 1 to 5 on the x-axis. Shaded regions around each line represent uncertainty or variance in the estimator's performance.
### Components/Axes
* **X-axis:** Labeled with numerical values ranging from 1 to 5, with tick marks at integer values.
* **Y-axis:** Ranges from approximately -3 to 2, with tick marks at integer values.
* **Lines:** Four lines are present, each representing a different estimator or error metric.
* Black dashed line: "Norm of f*"
* Red dotted line: "PDE error"
* Pink line with shaded region: "PDE estimator"
* Blue line with shaded region: "PIKL estimator"
* Orange line with shaded region: "Sobolev estimator"
* **Legend:** Located in the top-left corner, associating colors with each estimator/error metric.
### Detailed Analysis
The chart shows the following trends and approximate data points:
* **Norm of f* (Black Dashed Line):** This line is approximately horizontal, remaining relatively constant at a value of around 1.2 across the entire x-axis range.
* **PDE Error (Red Dotted Line):** This line is also approximately horizontal, positioned around -1.1.
* **PDE Estimator (Pink Line):** This line starts at approximately 1.1 at x=1 and slopes downward, reaching approximately -0.8 at x=5. The shaded region indicates a relatively wide range of uncertainty, particularly between x=1 and x=3.
* **PIKL Estimator (Blue Line):** This line begins at approximately 0.8 at x=1 and exhibits a steeper downward slope than the PDE estimator, reaching approximately -2.5 at x=5. The shaded region is narrower than that of the PDE estimator, suggesting lower variance.
* **Sobolev Estimator (Orange Line):** This line starts at approximately 0.9 at x=1 and slopes downward, similar to the PDE estimator, but with a slightly more pronounced decline. It reaches approximately -3.2 at x=5. The shaded region is comparable in width to that of the PDE estimator.
### Key Observations
* All three estimators (PDE, PIKL, and Sobolev) show a decreasing trend as the x-value increases, indicating that the estimated error generally decreases with increasing values on the x-axis.
* The PIKL estimator consistently estimates a lower error than the other two estimators across the entire range.
* The Sobolev estimator generally estimates a lower error than the PDE estimator.
* The uncertainty (as indicated by the shaded regions) is most significant for the PDE estimator.
* The "Norm of f*" and "PDE error" lines provide reference levels for evaluating the performance of the estimators.
### Interpretation
The chart demonstrates a comparison of different error estimation techniques. The downward trends of the estimators suggest that the error is reduced as the parameter (represented by the x-axis) increases. The PIKL estimator appears to be the most accurate, consistently providing the lowest error estimates. The wider uncertainty range for the PDE estimator suggests that it is less reliable than the PIKL and Sobolev estimators. The horizontal lines representing the "Norm of f*" and "PDE error" serve as benchmarks for assessing the quality of the error estimations. The fact that the estimators generally fall below the "PDE error" line indicates that they are successfully identifying and quantifying the error in the system. The differences between the estimators could be attributed to their underlying methodologies and assumptions. The chart suggests that the PIKL estimator is a robust and reliable method for error estimation in this context.