## Line Chart: Average Attention Weight Comparison
### Overview
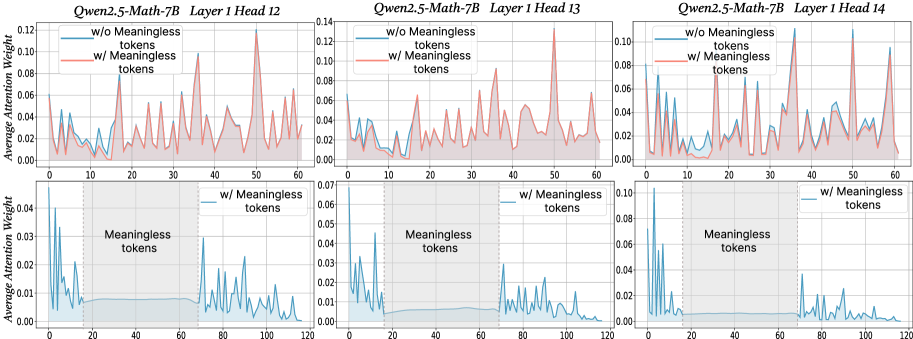
The image presents three pairs of line charts, each comparing the average attention weight of a language model (Qwen2.5-Math-7B) with and without "meaningless tokens." Each pair of charts corresponds to a different attention head (12, 13, and 14) within the first layer of the model. The top chart in each pair shows the attention weight over a shorter sequence length (0-60), while the bottom chart shows the attention weight over a longer sequence length (0-120), highlighting the region where "meaningless tokens" are present.
### Components/Axes
**General Chart Elements:**
* **Titles:** Each pair of charts has a title indicating the model ("Qwen2.5-Math-7B") and the specific layer and head number (Layer 1 Head 12, Layer 1 Head 13, Layer 1 Head 14).
* **Y-Axis:** Labeled "Average Attention Weight." The scale varies slightly between the top and bottom charts.
* **X-Axis:** Represents the token position in the sequence. The top charts range from 0 to 60, while the bottom charts range from 0 to 120.
* **Legends:** Each chart includes a legend indicating the two data series: "w/o Meaningless tokens" (blue line) and "w/ Meaningless tokens" (red line, only in the top charts). The bottom charts only show "w/ Meaningless tokens" (blue line).
* **Shaded Region:** The bottom charts have a shaded gray region labeled "Meaningless tokens," spanning approximately from token position 20 to 70.
* **Vertical Dashed Line:** A vertical dashed line is present at x=20 in the bottom charts, marking the start of the "Meaningless tokens" region.
**Specific Axis Scales:**
* **Top Charts (Heads 12, 13, 14):**
* Y-axis ranges from 0.00 to approximately 0.12 (Head 12), 0.14 (Head 13), and 0.10 (Head 14).
* X-axis ranges from 0 to 60.
* **Bottom Charts (Heads 12, 13, 14):**
* Y-axis ranges from 0.00 to approximately 0.04 (Head 12), 0.07 (Head 13), and 0.10 (Head 14).
* X-axis ranges from 0 to 120.
### Detailed Analysis
**Head 12 (Leftmost Charts):**
* **Top Chart:**
* **Blue Line (w/o Meaningless tokens):** Relatively low and stable, with values generally below 0.04.
* **Red Line (w/ Meaningless tokens):** More volatile, with several peaks reaching up to approximately 0.10.
* **Bottom Chart:**
* **Blue Line (w/ Meaningless tokens):** High attention weights at the beginning (0-20), then drops and remains low within the "Meaningless tokens" region (20-70), and increases again after 70.
**Head 13 (Center Charts):**
* **Top Chart:**
* **Blue Line (w/o Meaningless tokens):** Relatively low and stable, with values generally below 0.04.
* **Red Line (w/ Meaningless tokens):** More volatile, with several peaks reaching up to approximately 0.06.
* **Bottom Chart:**
* **Blue Line (w/ Meaningless tokens):** High attention weights at the beginning (0-20), then drops and remains low within the "Meaningless tokens" region (20-70), and increases again after 70.
**Head 14 (Rightmost Charts):**
* **Top Chart:**
* **Blue Line (w/o Meaningless tokens):** Relatively low and stable, with values generally below 0.04.
* **Red Line (w/ Meaningless tokens):** More volatile, with several peaks reaching up to approximately 0.08.
* **Bottom Chart:**
* **Blue Line (w/ Meaningless tokens):** High attention weights at the beginning (0-20), then drops and remains low within the "Meaningless tokens" region (20-70), and increases again after 70.
### Key Observations
* **Impact of Meaningless Tokens:** The presence of "meaningless tokens" (red line in top charts) generally leads to higher and more variable attention weights compared to when they are absent (blue line in top charts).
* **Attention Suppression:** In the bottom charts, the attention weight for "w/ Meaningless tokens" is suppressed within the "Meaningless tokens" region (20-70).
* **Initial Attention:** All bottom charts show high attention weights at the beginning of the sequence (0-20) when "meaningless tokens" are present.
* **Head Similarity:** The trends observed are qualitatively similar across the three attention heads (12, 13, and 14).
### Interpretation
The charts suggest that the presence of "meaningless tokens" significantly alters the attention patterns of the language model. The higher attention weights observed in the top charts indicate that the model is allocating more attention to these tokens. However, the bottom charts reveal that the model suppresses attention within the "Meaningless tokens" region, suggesting a mechanism to filter out or ignore these tokens. The initial high attention weights at the beginning of the sequence might indicate an initial processing or identification phase before the suppression mechanism kicks in. The similarity in trends across different attention heads suggests that this behavior is consistent across multiple parts of the model. This analysis highlights the model's ability to adapt its attention patterns based on the presence and location of "meaningless tokens."