## Bar Charts: Performance Comparison of Language Models
### Overview
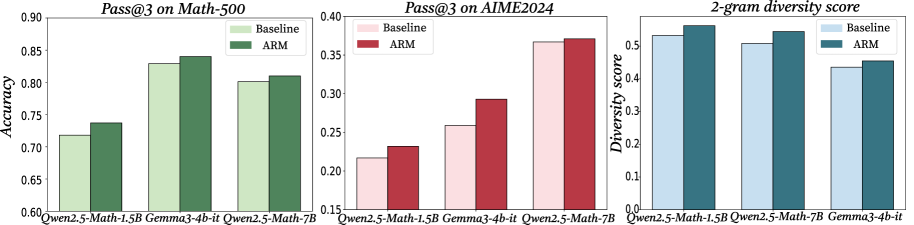
The image presents three bar charts comparing the performance of language models on different tasks. The charts compare a "Baseline" model against an "ARM" model across three metrics: "Pass@3 on Math-500", "Pass@3 on AIME2024", and "2-gram diversity score". The x-axis represents different language model configurations, while the y-axis represents the corresponding metric score.
### Components/Axes
**Chart 1: Pass@3 on Math-500**
* **Title:** Pass@3 on Math-500
* **Y-axis:** Accuracy, ranging from 0.60 to 0.90 in increments of 0.05.
* **X-axis:** Language model configurations:
* Qwen2.5-Math-1.5B
* Gemma3-4b-it
* Qwen2.5-Math-7B
* **Legend:** Located in the top-right corner.
* Baseline (light green)
* ARM (dark green)
**Chart 2: Pass@3 on AIME2024**
* **Title:** Pass@3 on AIME2024
* **Y-axis:** No label, ranging from 0.15 to 0.40 in increments of 0.05.
* **X-axis:** Language model configurations:
* Qwen2.5-Math-1.5B
* Gemma3-4b-it
* Qwen2.5-Math-7B
* **Legend:** Located in the top-left corner.
* Baseline (light pink)
* ARM (dark red)
**Chart 3: 2-gram diversity score**
* **Title:** 2-gram diversity score
* **Y-axis:** Diversity score, ranging from 0.0 to 0.5 in increments of 0.1.
* **X-axis:** Language model configurations:
* Qwen2.5-Math-1.5B
* Qwen2.5-Math-7B
* Gemma3-4b-it
* **Legend:** Located in the top-right corner.
* Baseline (light blue)
* ARM (dark teal)
### Detailed Analysis
**Chart 1: Pass@3 on Math-500**
* **Qwen2.5-Math-1.5B:**
* Baseline: Accuracy ~0.72
* ARM: Accuracy ~0.74
* **Gemma3-4b-it:**
* Baseline: Accuracy ~0.83
* ARM: Accuracy ~0.84
* **Qwen2.5-Math-7B:**
* Baseline: Accuracy ~0.80
* ARM: Accuracy ~0.81
**Trend:** The ARM model consistently outperforms the Baseline model across all language model configurations, but the difference is small.
**Chart 2: Pass@3 on AIME2024**
* **Qwen2.5-Math-1.5B:**
* Baseline: ~0.22
* ARM: ~0.23
* **Gemma3-4b-it:**
* Baseline: ~0.26
* ARM: ~0.29
* **Qwen2.5-Math-7B:**
* Baseline: ~0.37
* ARM: ~0.38
**Trend:** The ARM model consistently outperforms the Baseline model across all language model configurations.
**Chart 3: 2-gram diversity score**
* **Qwen2.5-Math-1.5B:**
* Baseline: ~0.53
* ARM: ~0.56
* **Qwen2.5-Math-7B:**
* Baseline: ~0.51
* ARM: ~0.54
* **Gemma3-4b-it:**
* Baseline: ~0.43
* ARM: ~0.45
**Trend:** The ARM model consistently outperforms the Baseline model across all language model configurations.
### Key Observations
* The ARM model consistently shows a slight improvement over the Baseline model in all three metrics.
* The "Pass@3 on AIME2024" metric has the lowest scores compared to the other two metrics.
* The "2-gram diversity score" metric has the highest scores compared to the other two metrics.
### Interpretation
The data suggests that the "ARM" modification consistently improves the performance of the language models across different tasks and metrics, although the improvement is relatively small. The "Pass@3 on AIME2024" metric appears to be a more challenging task for these models compared to "Pass@3 on Math-500" and "2-gram diversity score". The small performance differences between the Baseline and ARM models suggest that the ARM modification might be a fine-tuning or optimization technique that provides incremental improvements.