TECHNICAL ASSET FINGERPRINT
1ad46e7f45849fb3252c66ed
Click to view fullscreen
Press ESC or click to close
FOUND IN PAPERS
EXPERT: healer-alpha-free VERSION 1
RUNTIME: free/openrouter/healer-alpha
INTEL_VERIFIED
## [Multi-Panel Chart]: Scaling Laws for Model Competence and Brain Alignment
### Overview
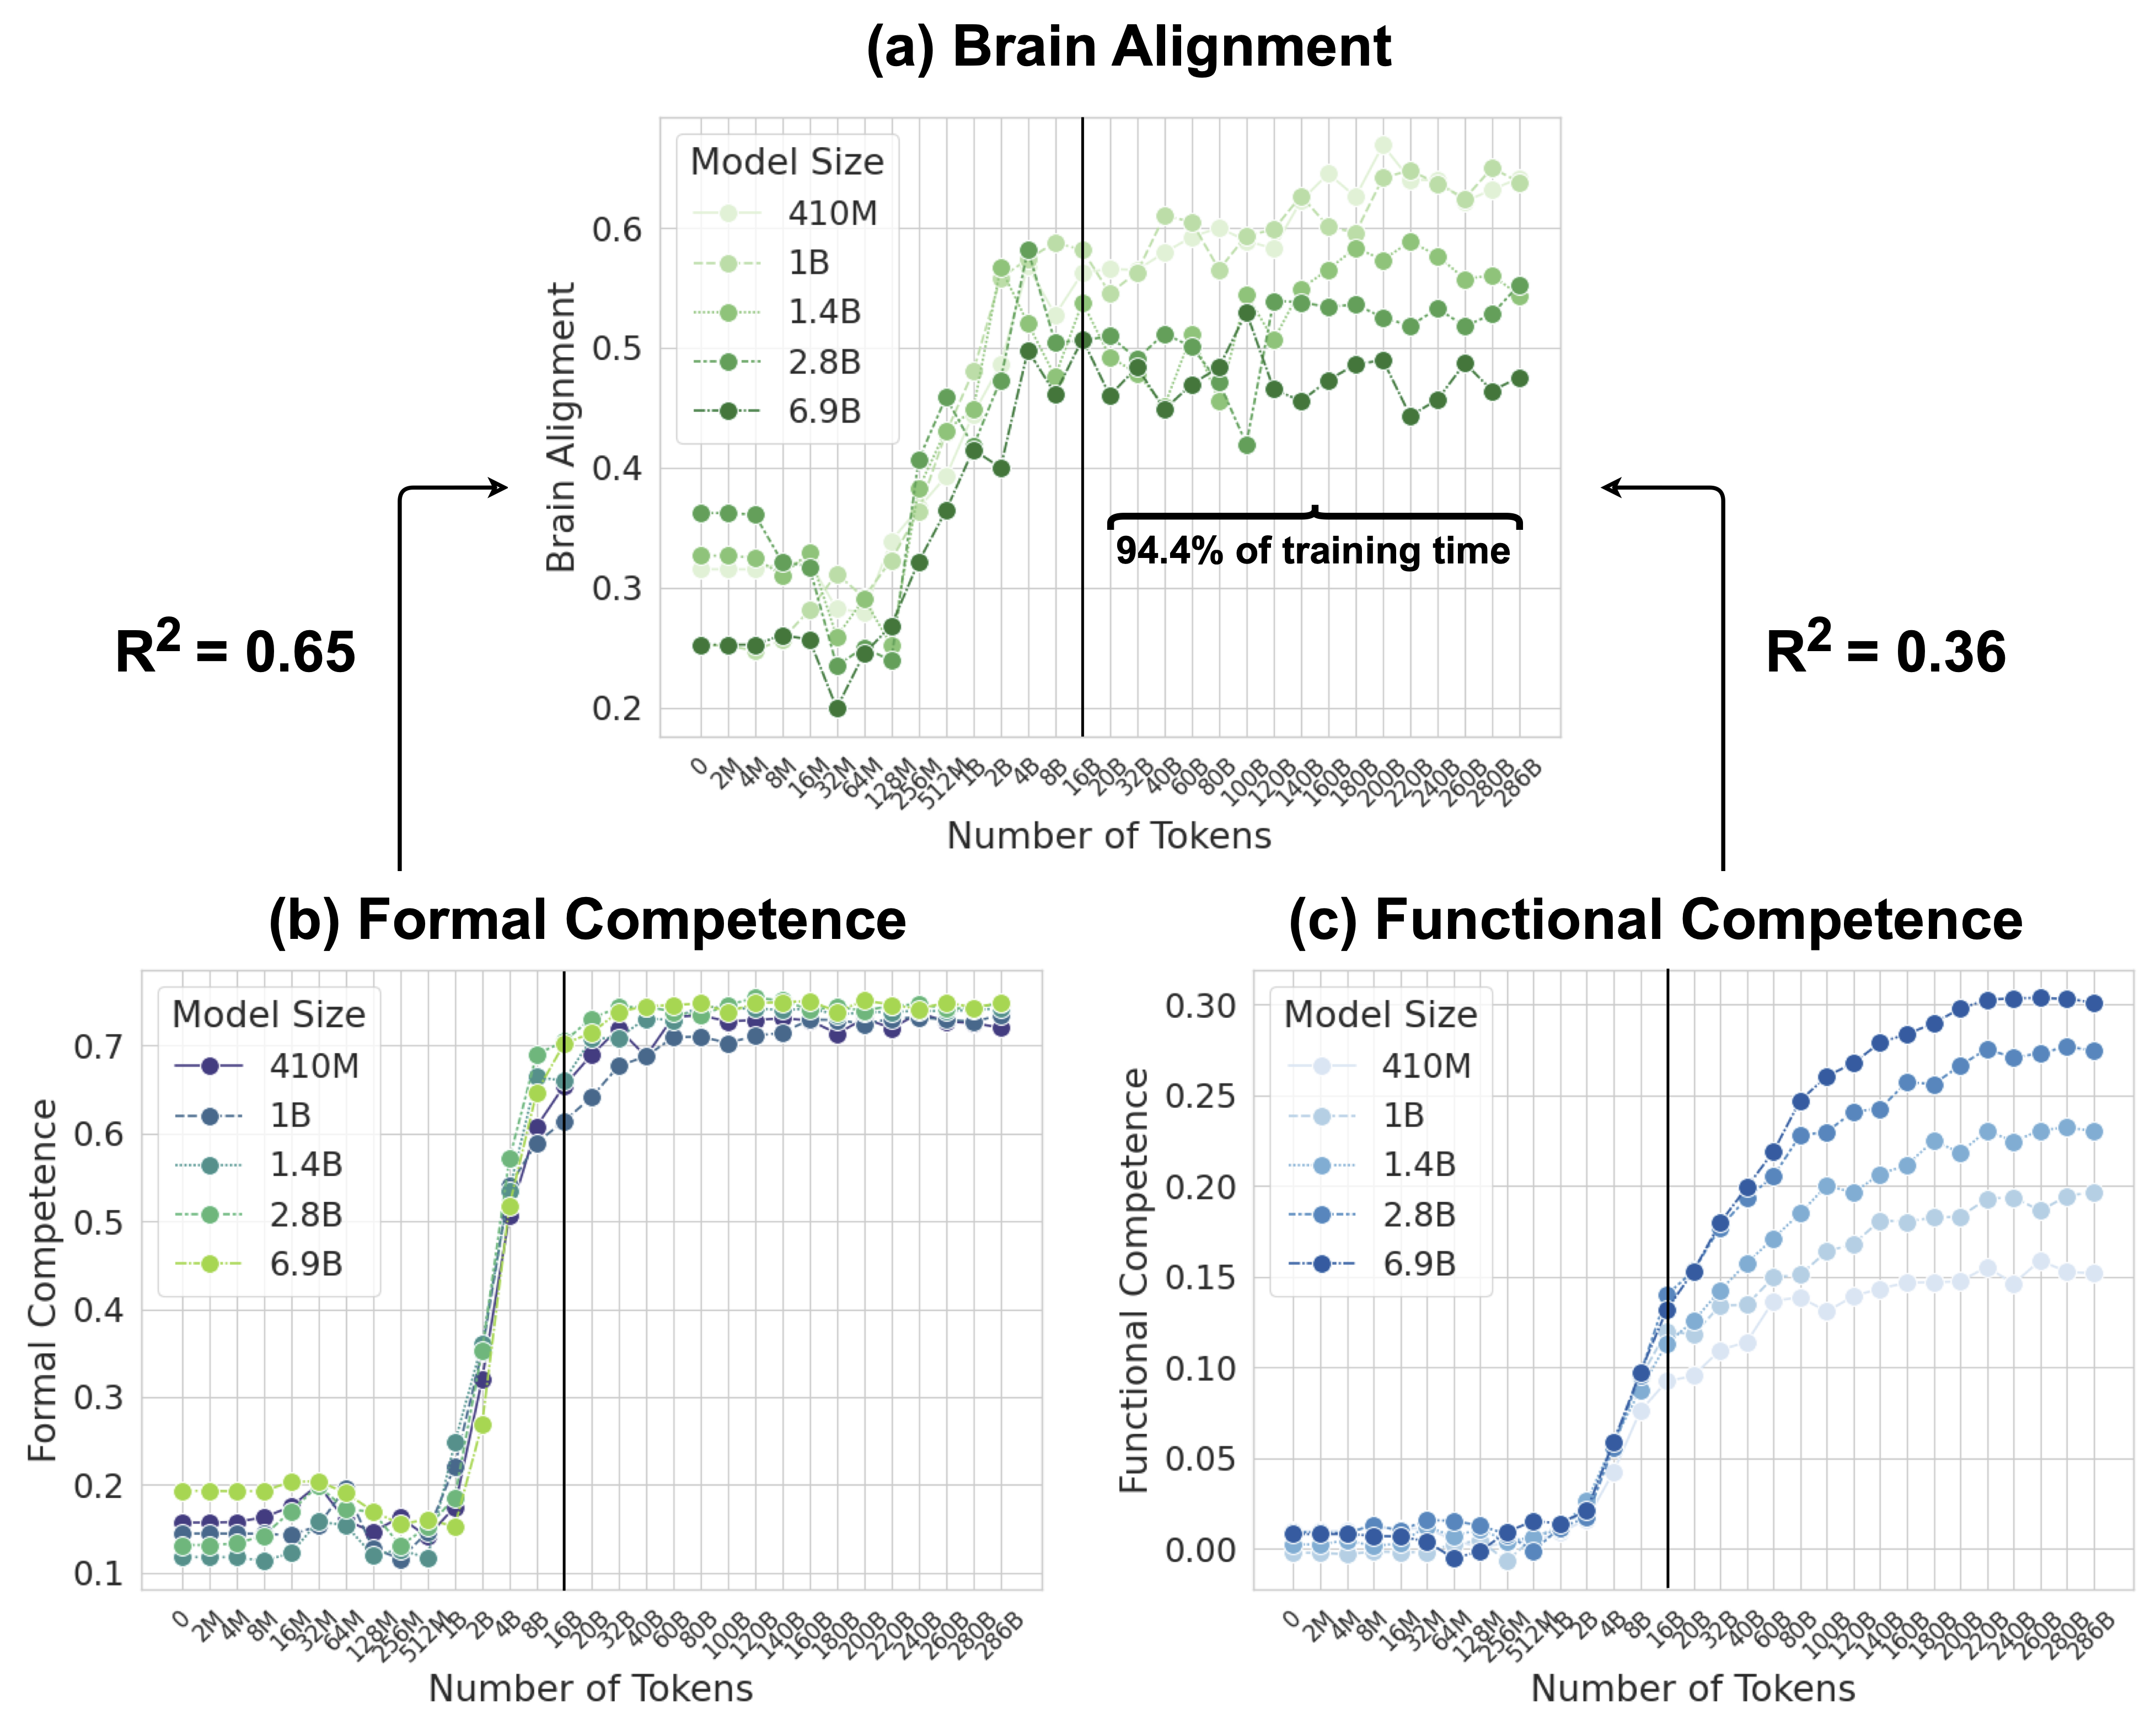
The image contains three line charts arranged in a triangular layout, labeled (a), (b), and (c). They collectively illustrate how different performance metrics of language models evolve as a function of training data (Number of Tokens) and model size. The charts share a common x-axis and a consistent vertical reference line at 16B tokens. The overall theme is the relationship between scale (model parameters and training data) and various forms of model capability.
### Components/Axes
**Common Elements:**
* **X-axis (All Charts):** "Number of Tokens". The scale is logarithmic, with major tick marks at: 0, 2M, 4M, 8M, 16M, 32M, 64M, 128M, 256M, 512M, 1B, 2B, 4B, 8B, 16B, 20B, 32B, 40B, 60B, 80B, 100B, 120B, 140B, 160B, 180B, 200B, 220B, 240B, 260B, 280B, 286B.
* **Vertical Reference Line:** A solid black vertical line is drawn at the 16B token mark in all three charts.
* **Model Size Legend:** Each chart has a legend titled "Model Size" with five entries, each associated with a specific color and line/marker style. The model sizes are: 410M, 1B, 1.4B, 2.8B, 6.9B.
**Chart-Specific Elements:**
* **(a) Brain Alignment (Top Center):**
* **Y-axis:** "Brain Alignment". Linear scale from 0.2 to 0.6.
* **Legend Colors:** Shades of green. 410M (lightest green, circle marker), 1B (light green, circle), 1.4B (medium green, circle), 2.8B (dark green, circle), 6.9B (darkest green, circle).
* **Annotations:**
* Left side: "R² = 0.65" with an arrow pointing to the left portion of the chart (before 16B).
* Right side: "R² = 0.36" with an arrow pointing to the right portion of the chart (after 16B).
* Above the right portion: A bracket labeled "94.4% of training time".
* **(b) Formal Competence (Bottom Left):**
* **Y-axis:** "Formal Competence". Linear scale from 0.1 to 0.7.
* **Legend Colors:** A gradient from dark purple/blue to yellow-green. 410M (dark purple, circle), 1B (blue, circle), 1.4B (teal, circle), 2.8B (green, circle), 6.9B (yellow-green, circle).
* **(c) Functional Competence (Bottom Right):**
* **Y-axis:** "Functional Competence". Linear scale from 0.00 to 0.30.
* **Legend Colors:** Shades of blue. 410M (lightest blue, circle), 1B (light blue, circle), 1.4B (medium blue, circle), 2.8B (dark blue, circle), 6.9B (darkest blue, circle).
### Detailed Analysis
**Chart (a) Brain Alignment:**
* **Trend Verification:** All five model size series show a similar pattern: a relatively flat or slightly noisy phase from 0 to ~512M tokens, followed by a steep, roughly linear increase (on this log-scale x-axis) from ~512M to 16B tokens. After the 16B token vertical line, the growth rate slows dramatically, and the lines plateau with significant noise/fluctuation.
* **Data Points (Approximate):**
* **Pre-16B (Steep Growth Phase):** At 512M tokens, values range from ~0.25 (6.9B model) to ~0.35 (410M model). At 16B tokens, values converge to a range of approximately 0.50 to 0.58.
* **Post-16B (Plateau Phase):** Values fluctuate between ~0.45 and ~0.62. The 410M model (lightest green) often shows the highest values in this region, while the 6.9B model (darkest green) is often among the lowest.
* **R² Annotation:** The coefficient of determination (R²) is 0.65 for the relationship between model size and brain alignment during the steep growth phase (left of 16B). It drops to 0.36 for the plateau phase (right of 16B), indicating model size is a weaker predictor of brain alignment after the 16B token mark.
**Chart (b) Formal Competence:**
* **Trend Verification:** All series show a very low, flat baseline (<0.2) from 0 to ~512M tokens. There is an extremely sharp, near-vertical increase between ~512M and 4B tokens. After ~4B tokens, all series reach a high plateau (between 0.65 and 0.75) and remain essentially flat with minimal growth up to 286B tokens.
* **Data Points (Approximate):**
* **Baseline (0-512M):** Values cluster between 0.10 and 0.20.
* **Sharp Rise (512M-4B):** Values jump from ~0.2 to over 0.6.
* **Plateau (4B-286B):** All model sizes converge into a tight band between approximately 0.68 and 0.75. There is no clear ordering by model size in the plateau; the lines are intertwined.
**Chart (c) Functional Competence:**
* **Trend Verification:** All series start near zero. There is a gradual, accelerating increase beginning around 512M tokens. The growth continues steadily past the 16B token line, showing no clear plateau within the plotted range. Larger models consistently achieve higher functional competence at any given token count after the initial rise.
* **Data Points (Approximate):**
* **Initial Rise (512M-16B):** At 16B tokens, values range from ~0.08 (410M) to ~0.18 (6.9B).
* **Continued Growth (16B-286B):** At the final point (286B tokens), values range from ~0.15 (410M) to ~0.30 (6.9B). The separation between model sizes is clear and maintained.
### Key Observations
1. **Phase Transition at 16B Tokens:** The vertical line at 16B tokens marks a critical point. Brain Alignment growth saturates here, while Functional Competence continues to grow. Formal Competence saturates much earlier (~4B tokens).
2. **Divergence of Metrics:** The three metrics behave fundamentally differently with scale. Brain Alignment and Formal Competence show saturation, while Functional Competence does not saturate within the observed data range.
3. **Model Size Effect:** The benefit of increased model size is most pronounced and consistent for Functional Competence. For Brain Alignment, larger models are not necessarily better after the 16B token point. For Formal Competence, model size makes little difference once the sharp rise is complete.
4. **Noise in Brain Alignment:** The post-16B region of the Brain Alignment chart shows high variance and noise compared to the smooth curves of the other two metrics.
### Interpretation
This data suggests a nuanced view of scaling language models. The findings can be interpreted through a Peircean lens of signs:
* **Formal Competence (Chart b)** appears to be a **symbol**—a learned, conventional capability (like grammatical correctness) that is acquired rapidly once a sufficient data threshold (~512M tokens) is crossed and then mastered, showing little further improvement with massive scale.
* **Brain Alignment (Chart a)** may function as an **index**—a sign that points to a causal relationship between model internal representations and human brain activity. The strong initial correlation (R²=0.65) suggests training data causally drives this alignment. The saturation and noise after 16B tokens imply this causal link weakens or becomes obscured by other factors at extreme scale, making model size a poor predictor (R²=0.36).
* **Functional Competence (Chart c)** behaves as an **icon**—it resembles or continuously maps onto real-world utility or problem-solving ability. Its steady, unsaturated growth with both data and model size suggests it is an open-ended capability that benefits from continued scaling, making it the most promising metric for predicting future performance gains.
**Notable Anomaly:** The 410M model often achieves the highest *Brain Alignment* scores in the plateau phase, which is counterintuitive. This could indicate that smaller models, perhaps due to simpler internal representations, develop patterns that coincidentally align better with certain measured brain signals after extensive training, even if they are less functionally competent. This highlights a potential decoupling between brain-alignment metrics and practical utility at the extremes of scale.
DECODING INTELLIGENCE...