\n
## Scatter Plot: Confidence vs. Target Length (High School Biology)
### Overview
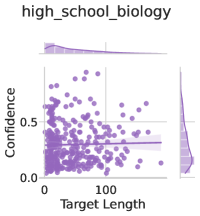
The image presents a scatter plot visualizing the relationship between "Target Length" and "Confidence" for data labeled as "high_school_biology". The plot displays a large number of data points, along with a regression line and confidence interval.
### Components/Axes
* **Title:** high\_school\_biology (top-center)
* **X-axis:** Target Length (bottom-center), ranging from approximately 0 to 120.
* **Y-axis:** Confidence (left-center), ranging from approximately 0.0 to 0.75.
* **Data Points:** Numerous purple dots scattered across the plot.
* **Regression Line:** A dark purple line representing the trend of the data.
* **Confidence Interval:** A shaded purple area surrounding the regression line, indicating the uncertainty in the estimated trend.
### Detailed Analysis
The scatter plot shows a generally weak, slightly negative correlation between Target Length and Confidence.
* **Data Point Distribution:** The majority of data points cluster between Target Length values of 0 and 100, with Confidence values primarily between 0.0 and 0.6. There are fewer data points with Target Length values exceeding 100.
* **Regression Line Trend:** The regression line is approximately horizontal, indicating a minimal overall trend. It slopes slightly downward.
* **Confidence Interval:** The confidence interval is relatively narrow, suggesting a reasonable degree of certainty in the estimated trend, despite its weakness.
* **Specific Data Points (Approximate):**
* At Target Length = 0, Confidence ranges from approximately 0.1 to 0.7.
* At Target Length = 50, Confidence ranges from approximately 0.1 to 0.6.
* At Target Length = 100, Confidence ranges from approximately 0.1 to 0.5.
* At Target Length = 120, Confidence drops to approximately 0.0-0.2.
### Key Observations
* The data exhibits significant scatter, indicating a weak relationship between Target Length and Confidence.
* There is a slight tendency for Confidence to decrease as Target Length increases, but this trend is not strong.
* The confidence interval is relatively consistent across the range of Target Length values.
* The data appears to be truncated on the right side, with fewer data points at higher Target Length values.
### Interpretation
The plot suggests that, for the "high\_school\_biology" dataset, the length of the target sequence (Target Length) has a limited impact on the confidence score. The weak negative correlation implies that longer target sequences might be associated with slightly lower confidence, but this effect is small and not statistically significant. The truncation of data at higher Target Lengths could indicate a limitation in the dataset or a natural boundary in the data generation process. The relatively narrow confidence interval suggests that the observed trend, while weak, is reasonably reliable within the observed range of Target Lengths. This could be related to the complexity of biological sequences and the challenges in accurately predicting their properties. The data suggests that other factors beyond target length likely play a more significant role in determining confidence scores in this context.