\n
## Diagram: Dynamic Systems Model - Adult-Child Interaction
### Overview
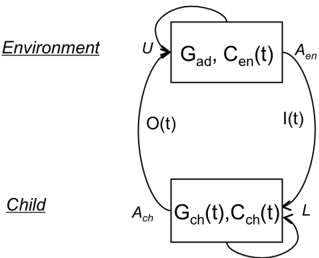
The image depicts a diagram illustrating a dynamic systems model of interaction between an adult and a child within an environment. It shows two rectangular blocks representing the "Adult" and "Child" systems, connected by several bidirectional arrows representing information and action flows. The diagram emphasizes the reciprocal influence between the two systems and their environment.
### Components/Axes
The diagram consists of the following labeled components:
* **Environment:** Labelled on the left side of the diagram.
* **Child:** Labelled on the bottom left side of the diagram.
* **Adult:** Represented by the top rectangular block. Contains the label "G<sub>ad</sub>, C<sub>en</sub>(t)".
* **Child:** Represented by the bottom rectangular block. Contains the label "G<sub>ch</sub>(t), C<sub>ch</sub>(t)".
* **U:** Input from the environment to the adult.
* **A<sub>en</sub>:** Output from the adult to the environment.
* **I(t):** Input from the environment to the child.
* **O(t):** Output from the child to the environment.
* **A<sub>ch</sub>:** Output from the child to the adult.
* **L:** Output from the adult to the child.
The arrows indicate the direction of influence or information flow. The arrows are curved, suggesting a continuous and dynamic interaction.
### Detailed Analysis or Content Details
The diagram represents a closed-loop system. The Adult system (G<sub>ad</sub>, C<sub>en</sub>(t)) receives input 'U' from the Environment and produces output 'A<sub>en</sub>' back into the Environment. The Child system (G<sub>ch</sub>(t), C<sub>ch</sub>(t)) receives input 'I(t)' from the Environment and produces output 'O(t)' back into the Environment. The Adult and Child systems also interact directly with each other via outputs 'A<sub>ch</sub>' and 'L' respectively.
The labels within the blocks suggest the following:
* **G<sub>ad</sub>:** Likely represents the "gain" or amplification factor for the Adult system.
* **C<sub>en</sub>(t):** Likely represents the "context" or state of the Environment at time 't' as perceived by the Adult.
* **G<sub>ch</sub>(t):** Likely represents the "gain" or amplification factor for the Child system at time 't'.
* **C<sub>ch</sub>(t):** Likely represents the "context" or state of the Environment at time 't' as perceived by the Child.
The arrows indicate a continuous feedback loop. The Adult's actions (A<sub>en</sub>) influence the Environment, which in turn influences the Child (I(t)). The Child's actions (O(t)) influence the Environment, which in turn influences the Adult (U). The direct interaction between Adult and Child (A<sub>ch</sub> and L) creates another feedback loop.
### Key Observations
The diagram highlights the interconnectedness of the Adult, Child, and Environment. It emphasizes that each system's behavior is influenced by, and influences, the others. The use of time-dependent variables (C<sub>en</sub>(t), C<sub>ch</sub>(t), G<sub>ch</sub>(t)) suggests that the system is dynamic and changes over time. The bidirectional arrows indicate reciprocal causality.
### Interpretation
This diagram illustrates a systems thinking approach to understanding adult-child interactions. It moves beyond a simple linear cause-and-effect model and recognizes the complex interplay of factors. The diagram suggests that interventions aimed at changing behavior in either the Adult or Child system must consider the broader context of the Environment and the reciprocal influences between the systems. The use of 'gain' and 'context' suggests that the system's response is not simply proportional to the input, but is also shaped by internal states and sensitivities. This model is useful for understanding how patterns of interaction can emerge and become self-sustaining, and how small changes in one part of the system can have cascading effects throughout the entire system. The diagram does not provide specific data or numerical values, but rather a conceptual framework for analyzing the dynamics of the interaction.