## Line Chart: Throughput vs. Hidden Size for A100 and V100 GPUs
### Overview
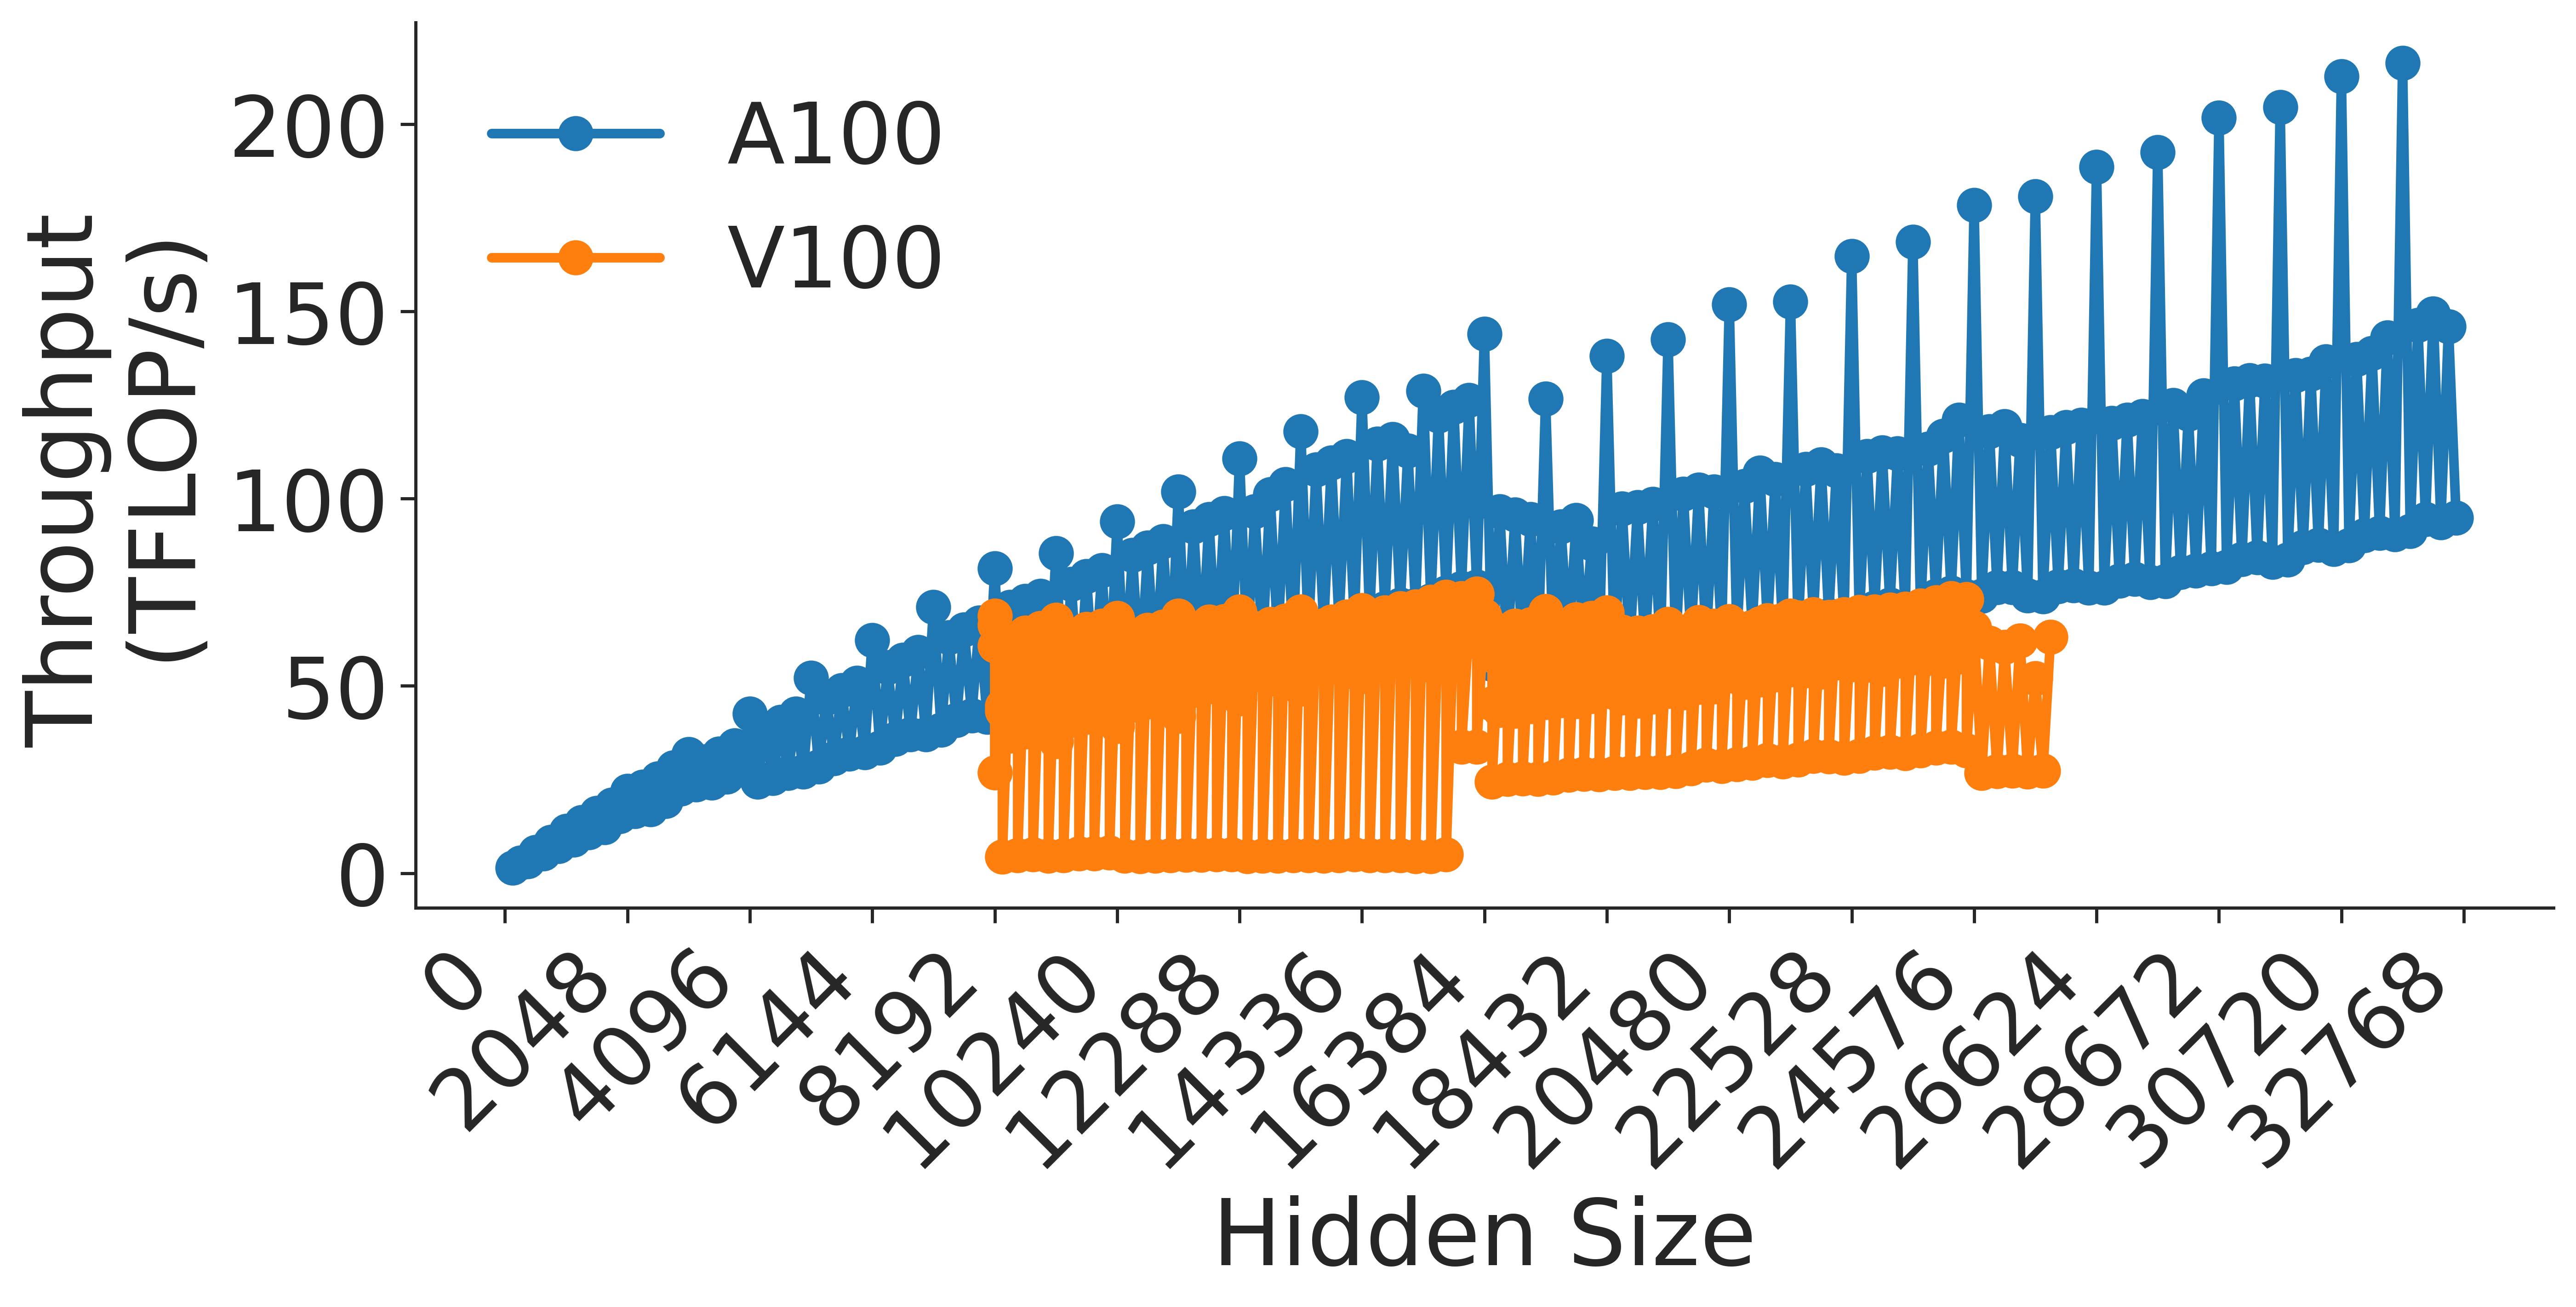
This image is a performance benchmark chart comparing the computational throughput (measured in TFLOP/s) of two NVIDIA GPU architectures, the A100 and the V100, across varying "Hidden Size" parameters. The chart illustrates a "sawtooth" performance pattern for both GPUs, indicating that throughput is highly dependent on specific hidden size values, likely due to memory alignment or kernel execution efficiency.
### Components/Axes
* **Y-Axis (Vertical):** Labeled "Throughput (TFLOP/s)". The scale is linear, ranging from 0 to 200, with major tick marks every 50 units.
* **X-Axis (Horizontal):** Labeled "Hidden Size". The scale is linear, ranging from 0 to 32768. The axis markers are provided in increments of 2048 (0, 2048, 4096, 6144, 8192, 10240, 12288, 14336, 16384, 18432, 20480, 22528, 24576, 26624, 28672, 30720, 32768).
* **Legend:** Located in the top-left quadrant of the chart area.
* **Blue line with circular markers:** Labeled "A100".
* **Orange line with circular markers:** Labeled "V100".
### Detailed Analysis
#### A100 (Blue Series)
* **Trend:** The A100 series shows a general upward trend in throughput as the hidden size increases. The data exhibits a distinct "sawtooth" pattern, where throughput rises and falls sharply across adjacent hidden size values.
* **Range:** Starts at 0 TFLOP/s (at hidden size 0) and reaches a peak of approximately 210 TFLOP/s at the maximum hidden size of 32768.
* **Discontinuity:** There is a notable performance drop at hidden size 16384. Prior to this point, the throughput peaks around 145 TFLOP/s. Immediately following 16384, the throughput resets to a lower baseline (approximately 80 TFLOP/s) before resuming its upward trajectory.
#### V100 (Orange Series)
* **Trend:** The V100 series also exhibits a "sawtooth" pattern, but with a much higher frequency of oscillation compared to the A100. It is confined to a specific range of hidden sizes.
* **Range:** The data begins at hidden size 10240 and terminates at hidden size 26624. Throughput oscillates between approximately 5 TFLOP/s and 75 TFLOP/s.
* **Discontinuity:** Similar to the A100, there is a shift at hidden size 16384. Before this point, the lower bound of the oscillations is near 5 TFLOP/s. After 16384, the lower bound of the oscillations shifts upward to approximately 30 TFLOP/s, while the upper bound remains relatively consistent around 75 TFLOP/s.
### Key Observations
* **Performance Gap:** The A100 consistently outperforms the V100 across all overlapping hidden sizes.
* **Shared Discontinuity:** Both GPU series exhibit a structural change in performance at hidden size 16384. This suggests a change in the underlying computational kernel, memory tiling strategy, or hardware resource allocation that occurs at this specific threshold.
* **Sawtooth Pattern:** The high-frequency oscillations (sawtooth pattern) are characteristic of GPU kernels where performance is sensitive to whether the hidden size is a multiple of the warp size or the tile size used in matrix multiplication.
### Interpretation
The data demonstrates that computational throughput on these GPUs is not a smooth function of hidden size but is instead highly sensitive to specific architectural alignments.
The "sawtooth" pattern indicates that for certain hidden sizes, the GPU kernels are highly efficient (peaks), while for others, they are inefficient (troughs), likely due to memory bank conflicts or under-utilization of the GPU's streaming multiprocessors. The discontinuity at 16384 is a critical "cliff" in the data, suggesting that the software implementation likely switches to a different algorithm or memory access pattern at this size to handle larger workloads, which initially incurs a performance penalty before scaling up again. The A100's superior performance and ability to scale to higher throughputs confirm its architectural advantage over the V100 for these specific operations.