## Chart: Average Response Length
### Overview
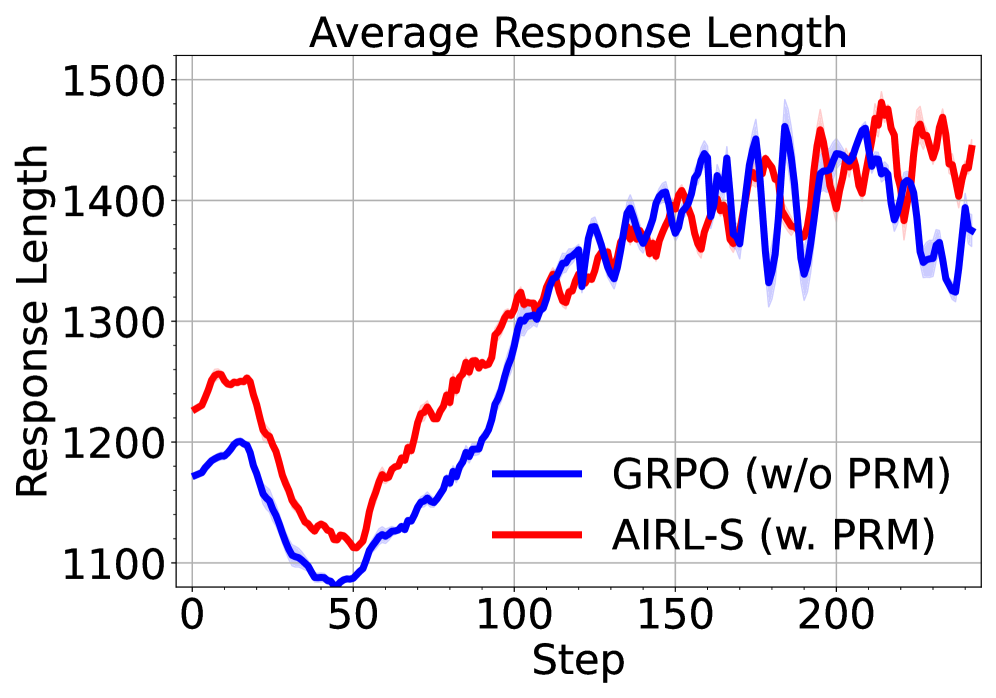
The image is a line chart comparing the average response length of two algorithms, GRPO (without PRM) and AIRL-S (with PRM), over a series of steps. The chart displays the response length on the y-axis and the step number on the x-axis. Both algorithms show an initial decrease in response length, followed by a significant increase and then a period of fluctuation.
### Components/Axes
* **Title:** Average Response Length
* **X-axis:** Step, with markers at 0, 50, 100, 150, and 200.
* **Y-axis:** Response Length, with markers at 1100, 1200, 1300, 1400, and 1500.
* **Legend:** Located in the bottom-right corner.
* Blue line: GRPO (w/o PRM)
* Red line: AIRL-S (w. PRM)
### Detailed Analysis
* **GRPO (w/o PRM) - Blue Line:**
* Trend: Initially decreases from approximately 1200 at step 0 to a minimum of approximately 1120 around step 50. Then, it increases steadily to approximately 1400 around step 150. After step 150, it fluctuates between 1350 and 1450 until step 250.
* Data Points:
* Step 0: ~1200
* Step 50: ~1120
* Step 100: ~1250
* Step 150: ~1400
* Step 200: ~1450
* Step 250: ~1350
* **AIRL-S (w. PRM) - Red Line:**
* Trend: Starts at approximately 1250 at step 0, decreases to a minimum of approximately 1080 around step 50. Then, it increases sharply to approximately 1380 around step 150. After step 150, it fluctuates between 1300 and 1500 until step 250.
* Data Points:
* Step 0: ~1250
* Step 50: ~1080
* Step 100: ~1300
* Step 150: ~1380
* Step 200: ~1480
* Step 250: ~1400
### Key Observations
* Both algorithms experience a dip in response length around step 50.
* Both algorithms show a significant increase in response length between steps 50 and 150.
* After step 150, both algorithms exhibit fluctuations in response length.
* The AIRL-S algorithm generally has a slightly higher average response length than the GRPO algorithm, especially after step 150.
### Interpretation
The chart suggests that both GRPO (without PRM) and AIRL-S (with PRM) algorithms initially struggle to maintain a consistent response length, as indicated by the dip around step 50. However, both algorithms improve significantly between steps 50 and 150, leading to a substantial increase in response length. The fluctuations after step 150 indicate that the algorithms are still adapting and refining their responses. The AIRL-S algorithm, which incorporates PRM, tends to produce slightly longer responses on average compared to the GRPO algorithm, which does not use PRM. This could indicate that PRM contributes to more verbose or detailed responses.