\n
## Line Chart: Average Response Length
### Overview
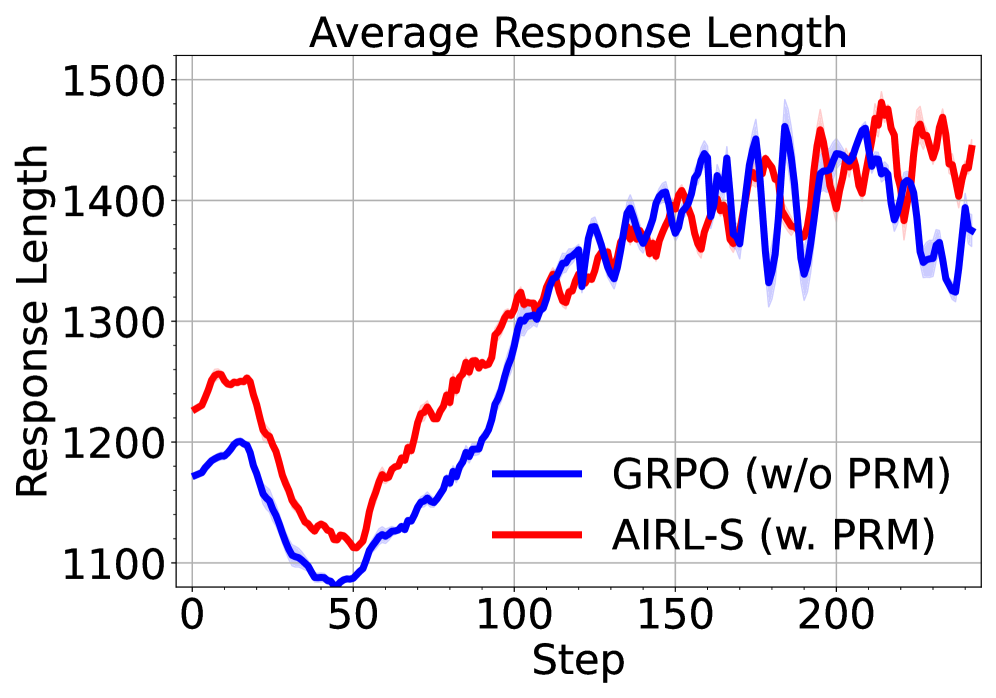
This image presents a line chart illustrating the average response length over a series of steps for two different models: GRPO (without Preference Ranking Model - PRM) and AIRL-S (with PRM). The chart displays how the average response length changes as the step number increases.
### Components/Axes
* **Title:** Average Response Length
* **X-axis:** Step (ranging from approximately 0 to 220)
* **Y-axis:** Response Length (ranging from approximately 1100 to 1500)
* **Legend:**
* Blue Line: GRPO (w/o PRM)
* Red Line: AIRL-S (w. PRM)
* **Grid:** A light gray grid is present in the background to aid in reading values.
### Detailed Analysis
The chart shows two distinct lines representing the average response length for each model over the steps.
**GRPO (w/o PRM) - Blue Line:**
The blue line starts at approximately 1200 at step 0. It initially decreases to a minimum of around 1130 at step 10. From step 10 to approximately step 100, the line exhibits a generally upward trend, increasing to around 1380. Between steps 100 and 220, the line fluctuates significantly, oscillating between approximately 1400 and 1500.
**AIRL-S (w. PRM) - Red Line:**
The red line begins at approximately 1250 at step 0. It also initially decreases, reaching a minimum of around 1150 at step 10. From step 10 to approximately step 100, the red line shows a consistent upward trend, increasing to around 1400. Between steps 100 and 220, the red line also fluctuates, but its oscillations are less pronounced than those of the blue line, generally staying between approximately 1400 and 1480.
**Approximate Data Points (extracted visually):**
| Step | GRPO (Blue) | AIRL-S (Red) |
|---|---|---|
| 0 | 1200 | 1250 |
| 10 | 1130 | 1150 |
| 50 | 1280 | 1320 |
| 100 | 1380 | 1400 |
| 150 | 1450 | 1430 |
| 200 | 1480 | 1460 |
| 220 | 1430 | 1440 |
### Key Observations
* Both models exhibit an initial decrease in average response length followed by an increase.
* AIRL-S (with PRM) consistently demonstrates a higher average response length than GRPO (without PRM) after step 50.
* The fluctuations in average response length are more pronounced for GRPO (without PRM) in the later stages (steps 100-220).
* The difference in average response length between the two models appears to stabilize around 100-200 units after step 100.
### Interpretation
The data suggests that incorporating a Preference Ranking Model (PRM), as done in AIRL-S, leads to a higher average response length compared to not using a PRM (GRPO). The initial decrease in response length for both models could be due to a learning phase where the models are initially calibrating. The subsequent increase suggests that the models are learning to generate more comprehensive or detailed responses. The fluctuations in the later stages might indicate a degree of instability or variance in the response generation process. The more pronounced fluctuations in GRPO suggest that the absence of a PRM makes the response length more sensitive to variations in the input or the learning process. The consistent higher response length of AIRL-S indicates that the PRM is effectively guiding the model to produce longer, potentially more informative, responses.