## Decision Tree: Probability of Heart Disease - Global vs. Local
### Overview
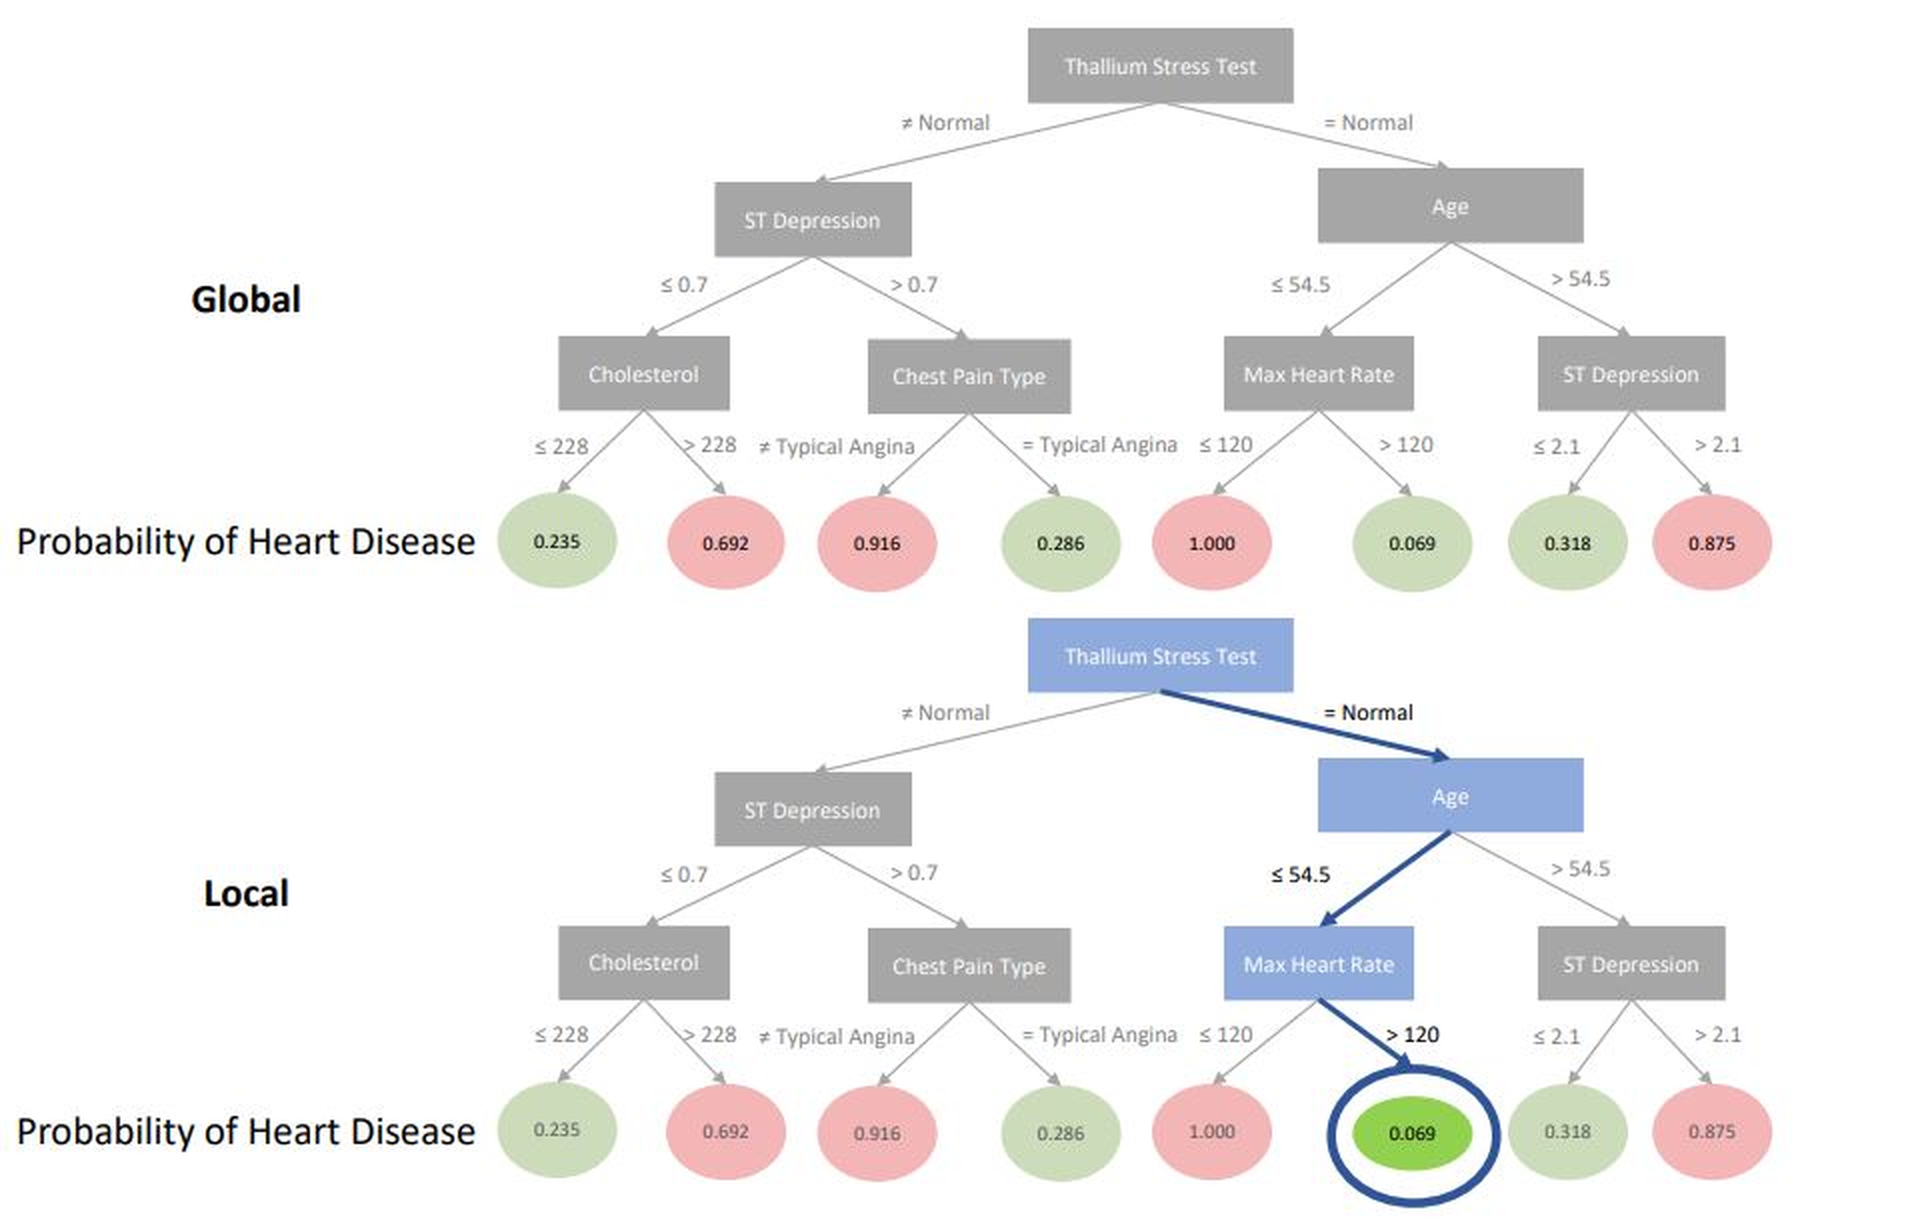
The image presents two decision trees, labeled "Global" and "Local," illustrating the probability of heart disease based on various factors. The trees use a series of binary splits based on medical test results and patient characteristics to arrive at a probability score. The nodes are colored green for lower probability and red for higher probability of heart disease. The "Local" tree highlights a specific path with a blue line and a blue-bordered node.
### Components/Axes
* **Nodes:** Rectangular nodes represent decision points based on features like "Thallium Stress Test," "Age," "ST Depression," "Cholesterol," "Chest Pain Type," and "Max Heart Rate."
* **Branches:** Lines connecting the nodes represent the outcomes of the decisions (e.g., "≠ Normal" or "= Normal").
* **Leaf Nodes:** Circular nodes at the bottom represent the final probability of heart disease, with values ranging from 0.069 to 1.000.
* **Probability of Heart Disease:** Label indicating the values in the leaf nodes.
* **Global:** Label indicating the first decision tree.
* **Local:** Label indicating the second decision tree.
### Detailed Analysis
**Global Decision Tree:**
* **Root Node:** "Thallium Stress Test" splits into "≠ Normal" and "= Normal."
* **If Thallium Stress Test ≠ Normal:**
* "ST Depression" splits at ≤0.7 and >0.7.
* If ST Depression ≤0.7: "Cholesterol" splits at ≤228 (probability 0.235, green) and >228 (probability 0.692, red).
* If ST Depression >0.7: "Chest Pain Type" splits at ≠ Typical Angina (probability 0.916, red) and = Typical Angina (probability 0.286, green).
* **If Thallium Stress Test = Normal:**
* "Age" splits at ≤54.5 and >54.5.
* If Age ≤54.5: "Max Heart Rate" splits at ≤120 (probability 1.000, red) and >120 (probability 0.069, green).
* If Age >54.5: "ST Depression" splits at ≤2.1 (probability 0.318, green) and >2.1 (probability 0.875, red).
**Local Decision Tree:**
* The "Local" tree is identical in structure to the "Global" tree, but a specific path is highlighted in blue.
* **Highlighted Path:**
* "Thallium Stress Test" = Normal (blue line)
* "Age" ≤54.5 (blue line)
* "Max Heart Rate" >120 (blue line)
* Resulting Probability: 0.069 (green node with blue border)
### Key Observations
* The decision trees use a combination of test results (Thallium Stress Test, ST Depression) and patient characteristics (Age, Cholesterol, Chest Pain Type, Max Heart Rate) to estimate the probability of heart disease.
* Higher cholesterol levels and ST depression generally correlate with a higher probability of heart disease.
* The "Local" tree highlights a scenario where a normal Thallium Stress Test, younger age (≤54.5), and higher maximum heart rate (>120) result in a low probability of heart disease (0.069).
### Interpretation
The decision trees provide a visual representation of how different factors contribute to the probability of heart disease. The "Global" tree shows the overall decision-making process, while the "Local" tree emphasizes a specific scenario and its outcome. The highlighted path in the "Local" tree suggests a case where, despite other potential risk factors, the combination of a normal Thallium Stress Test, younger age, and higher maximum heart rate significantly reduces the estimated probability of heart disease. The trees could be used to help doctors assess patient risk and make informed treatment decisions.