## Line Chart: Accuracy vs. Sample Size
### Overview
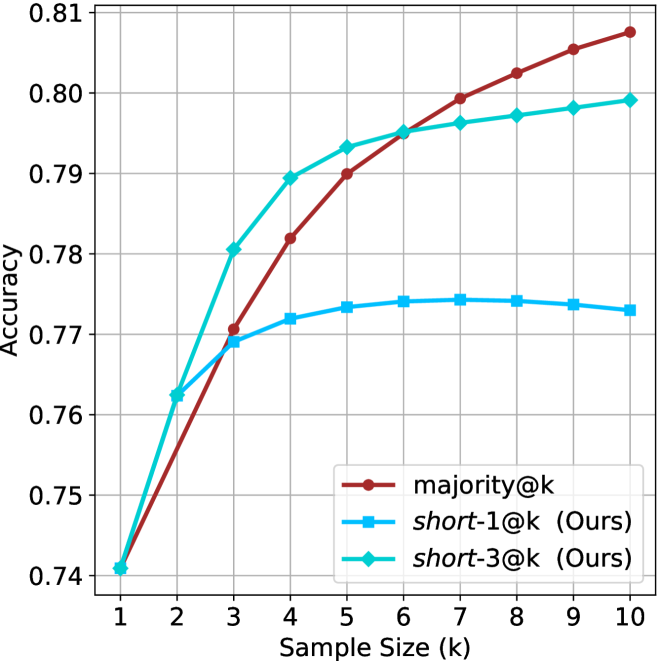
The image is a line chart comparing the accuracy of three different methods ("majority@k", "short-1@k (Ours)", and "short-3@k (Ours)") as a function of sample size (k), which ranges from 1 to 10. The y-axis represents accuracy, ranging from 0.74 to 0.81.
### Components/Axes
* **X-axis:** Sample Size (k), with integer values from 1 to 10.
* **Y-axis:** Accuracy, ranging from 0.74 to 0.81, with gridlines at intervals of 0.01.
* **Legend:** Located in the bottom-right corner, it identifies the three data series:
* **Brown line with circle markers:** "majority@k"
* **Light blue line with square markers:** "short-1@k (Ours)"
* **Light blue line with diamond markers:** "short-3@k (Ours)"
### Detailed Analysis
* **majority@k (Brown line with circle markers):**
* Trend: The line slopes upward, indicating increasing accuracy with larger sample sizes.
* Data Points:
* k=1: Accuracy ≈ 0.74
* k=3: Accuracy ≈ 0.77
* k=5: Accuracy ≈ 0.785
* k=7: Accuracy ≈ 0.80
* k=10: Accuracy ≈ 0.808
* **short-1@k (Ours) (Light blue line with square markers):**
* Trend: The line increases initially, then plateaus and slightly decreases.
* Data Points:
* k=1: Accuracy ≈ 0.74
* k=3: Accuracy ≈ 0.77
* k=5: Accuracy ≈ 0.773
* k=7: Accuracy ≈ 0.774
* k=10: Accuracy ≈ 0.772
* **short-3@k (Ours) (Light blue line with diamond markers):**
* Trend: The line slopes upward, but the rate of increase diminishes as sample size increases.
* Data Points:
* k=1: Accuracy ≈ 0.74
* k=3: Accuracy ≈ 0.78
* k=5: Accuracy ≈ 0.793
* k=7: Accuracy ≈ 0.796
* k=10: Accuracy ≈ 0.799
### Key Observations
* The "majority@k" method consistently shows the highest accuracy for sample sizes greater than 3.
* The "short-1@k (Ours)" method plateaus at a lower accuracy compared to the other two methods.
* The "short-3@k (Ours)" method initially increases rapidly in accuracy, but the rate of increase slows down as the sample size increases.
### Interpretation
The chart compares the performance of three different methods for a task, likely a classification or prediction task, based on the accuracy achieved with varying sample sizes. The "majority@k" method appears to be the most effective, achieving the highest accuracy as the sample size increases. The "short-1@k (Ours)" method seems to have limited effectiveness, as its accuracy plateaus early on. The "short-3@k (Ours)" method shows a good initial increase in accuracy, but its performance plateaus as well, though at a higher level than "short-1@k (Ours)". The data suggests that increasing the sample size is most beneficial for the "majority@k" method, while the other two methods reach a point of diminishing returns. The "(Ours)" annotation suggests that "short-1@k" and "short-3@k" are novel methods being proposed by the authors of the chart.