## Line Chart: Accuracy vs. Sample Size (k)
### Overview
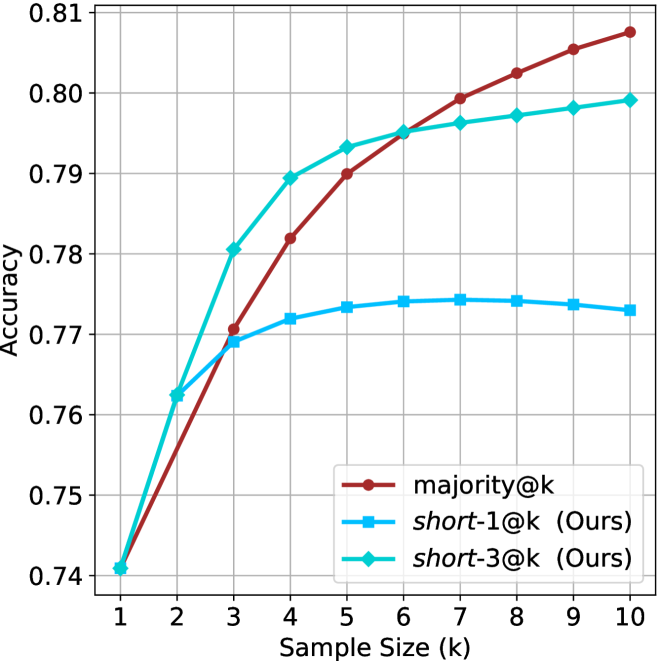
This chart illustrates the performance (Accuracy) of three different methods—`majority@k`, `short-1@k (Ours)`, and `short-3@k (Ours)`—across varying sample sizes (k) ranging from 1 to 10. The chart demonstrates how accuracy scales as the sample size increases.
### Components/Axes
* **Y-Axis:** Labeled "Accuracy". The scale ranges from 0.74 to 0.81, with grid lines at 0.01 intervals.
* **X-Axis:** Labeled "Sample Size (k)". The scale ranges from 1 to 10 in integer increments.
* **Legend:** Located in the bottom-right quadrant of the chart area.
* **`majority@k`**: Represented by a dark red line with circle markers.
* **`short-1@k (Ours)`**: Represented by a light blue line with square markers.
* **`short-3@k (Ours)`**: Represented by a cyan/teal line with diamond markers.
### Detailed Analysis
The chart displays three distinct trends starting from a common point at k=1.
**Data Series Trends:**
* **`majority@k` (Dark Red/Circles):** This line shows a consistent, steady upward slope from k=1 to k=10. It starts at the lowest point (tied with others) and ends as the highest performing method.
* **`short-1@k (Ours)` (Light Blue/Squares):** This line rises from k=1, but the rate of increase slows significantly after k=3. It reaches a plateau around k=6 and exhibits a very slight downward trend from k=7 to k=10.
* **`short-3@k (Ours)` (Cyan/Diamonds):** This line shows the steepest initial increase between k=1 and k=3. It outperforms the other two methods between k=2 and k=5. However, its growth rate slows significantly after k=5, and it is overtaken by `majority@k` at approximately k=6.
**Estimated Data Points (Approximate):**
| Sample Size (k) | majority@k (Red) | short-1@k (Light Blue) | short-3@k (Cyan) |
| :--- | :--- | :--- | :--- |
| 1 | ~0.741 | ~0.741 | ~0.741 |
| 2 | ~0.756 | ~0.762 | ~0.763 |
| 3 | ~0.771 | ~0.769 | ~0.780 |
| 4 | ~0.782 | ~0.772 | ~0.789 |
| 5 | ~0.790 | ~0.773 | ~0.793 |
| 6 | ~0.795 | ~0.774 | ~0.795 |
| 7 | ~0.799 | ~0.774 | ~0.796 |
| 8 | ~0.802 | ~0.774 | ~0.797 |
| 9 | ~0.805 | ~0.773 | ~0.798 |
| 10 | ~0.807 | ~0.773 | ~0.799 |
### Key Observations
* **Convergence at k=1:** All three methods begin with identical accuracy at a sample size of 1.
* **Early Performance:** The "Ours" methods (`short-1@k` and `short-3@k`) provide superior accuracy compared to `majority@k` in the low-sample regime (k=2 to k=5).
* **Crossover Point:** At k=6, the `majority@k` method intersects with `short-3@k` and becomes the superior method for all subsequent sample sizes.
* **Diminishing Returns:** Both "Ours" methods exhibit significant diminishing returns as k increases, whereas `majority@k` maintains a more linear, sustained improvement.
### Interpretation
The data suggests that the "Ours" methods are specifically optimized for low-data environments (k < 6), where they provide a clear advantage over the `majority@k` baseline. However, these methods appear to hit a performance ceiling quickly.
Conversely, `majority@k` is a more robust method for larger sample sizes. It demonstrates that while it may be less effective when data is scarce, it scales better as more data becomes available. The slight decline in accuracy for `short-1@k` after k=6 suggests potential overfitting or noise sensitivity as the sample size increases, whereas `majority@k` continues to benefit from the additional information.