## Histogram: First Correct Answer Emergence
### Overview
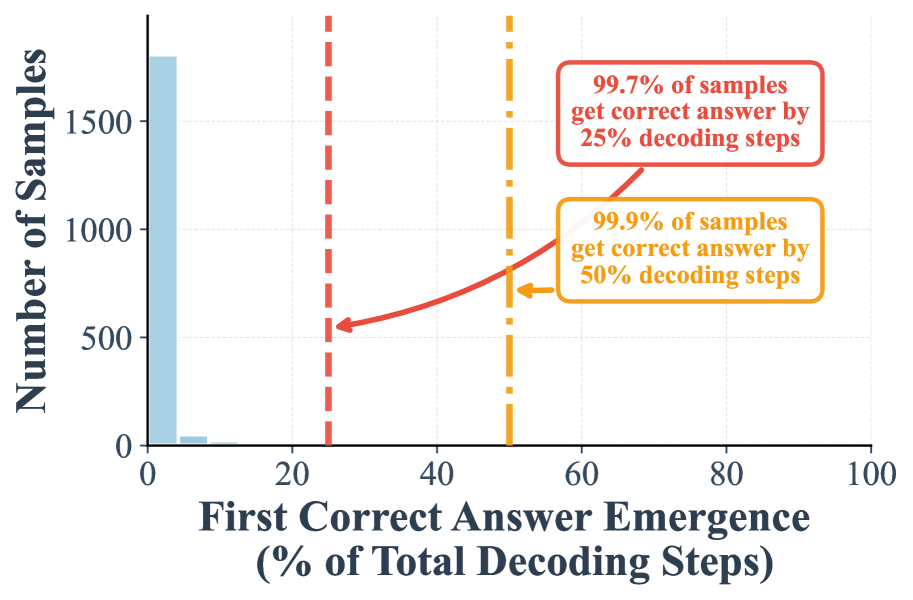
The image is a histogram showing the distribution of the "First Correct Answer Emergence" as a percentage of total decoding steps. It also includes annotations indicating the percentage of samples that achieve a correct answer within 25% and 50% of the decoding steps.
### Components/Axes
* **X-axis:** "First Correct Answer Emergence (% of Total Decoding Steps)". The scale ranges from 0 to 100, with tick marks at intervals of 20.
* **Y-axis:** "Number of Samples". The scale ranges from 0 to 1500, with tick marks at intervals of 500.
* **Bars:** Light blue bars represent the frequency of samples for each percentage range of "First Correct Answer Emergence".
* **Vertical Dashed Lines:** A red dashed vertical line is positioned at approximately 25 on the x-axis. An orange dashed-dotted vertical line is positioned at approximately 50 on the x-axis.
* **Annotations:**
* A red rounded rectangle contains the text "99.7% of samples get correct answer by 25% decoding steps". An arrow points from the rectangle to the red dashed line.
* An orange rounded rectangle contains the text "99.9% of samples get correct answer by 50% decoding steps". An arrow points from the rectangle to the orange dashed-dotted line.
### Detailed Analysis
* **Bar Distribution:** The majority of samples have their first correct answer emerge very early in the decoding process. The tallest bar is at the beginning of the x-axis, indicating that a large number of samples achieve a correct answer within a small percentage of the total decoding steps. The height of this bar is approximately 1750. The other bars are significantly smaller, indicating fewer samples with later correct answer emergence.
* **Red Dashed Line:** This line is positioned at approximately 25% of total decoding steps. The annotation indicates that 99.7% of samples get the correct answer by this point.
* **Orange Dashed-Dotted Line:** This line is positioned at approximately 50% of total decoding steps. The annotation indicates that 99.9% of samples get the correct answer by this point.
### Key Observations
* The distribution is heavily skewed towards the left, indicating that most samples achieve a correct answer early in the decoding process.
* A very high percentage of samples (99.7%) achieve a correct answer within the first 25% of decoding steps.
* An even higher percentage of samples (99.9%) achieve a correct answer within the first 50% of decoding steps.
### Interpretation
The data suggests that the decoding process is highly efficient, with the vast majority of samples achieving a correct answer very early on. The fact that 99.7% of samples get the correct answer by 25% decoding steps and 99.9% by 50% decoding steps indicates that the model or algorithm being evaluated is performing well. The rapid convergence to a correct answer suggests that the model is robust and efficient in its decoding process. The difference between 99.7% and 99.9% suggests that there are diminishing returns in continuing the decoding process beyond 25% of the total steps.