\n
## Chart: First Correct Answer Emergence vs. Number of Samples
### Overview
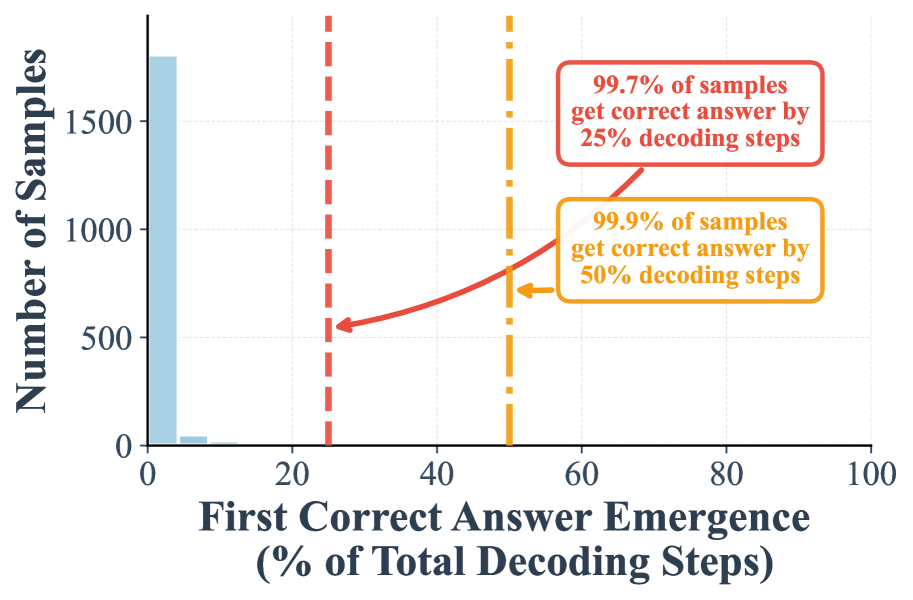
The image presents a chart illustrating the relationship between the percentage of total decoding steps required for the first correct answer emergence and the number of samples. The chart uses a bar graph for the initial data points and a line graph to represent the trend as the percentage of decoding steps increases. Annotations highlight key milestones in the data.
### Components/Axes
* **X-axis Title:** "First Correct Answer Emergence (% of Total Decoding Steps)" - Scale ranges from 0 to 100, with major ticks at 0, 20, 40, 60, 80, and 100.
* **Y-axis Title:** "Number of Samples" - Scale ranges from 0 to 1600, with major ticks at 0, 500, 1000, and 1500.
* **Data Series 1:** Bar graph representing the number of samples at or below 20% decoding steps. Color: Light Blue.
* **Data Series 2:** Line graph representing the number of samples as the percentage of decoding steps increases beyond 20%. Color: Maroon.
* **Annotation 1:** "99.7% of samples get correct answer by 25 decoding steps" - Located in the top-right quadrant, with a dashed vertical line at approximately 25% on the x-axis. Color: Red.
* **Annotation 2:** "99.9% of samples get correct answer by 50 decoding steps" - Located in the bottom-right quadrant, with a dotted vertical line at approximately 50% on the x-axis. Color: Orange.
### Detailed Analysis
* **Bar Graph (0-20% Decoding Steps):** The bar reaches a height of approximately 1600 samples at 0% decoding steps. The number of samples decreases to approximately 500 samples at 20% decoding steps.
* **Line Graph (20-100% Decoding Steps):** The line starts at approximately 500 samples (corresponding to 20% decoding steps) and exhibits a generally upward trend.
* At 25% decoding steps (indicated by the red dashed line), the line reaches approximately 800 samples.
* At 50% decoding steps (indicated by the orange dotted line), the line reaches approximately 1000 samples.
* The line continues to increase, but at a decreasing rate, reaching approximately 1100 samples at 60% decoding steps and approximately 1200 samples at 80% decoding steps.
* **Data Points (Approximate):**
* (0%, 1600 samples)
* (20%, 500 samples)
* (25%, 800 samples)
* (50%, 1000 samples)
* (60%, 1100 samples)
* (80%, 1200 samples)
### Key Observations
* There is a significant drop in the number of samples achieving a correct answer within the first 20% of decoding steps.
* The rate of increase in the number of samples achieving a correct answer slows down as the percentage of decoding steps increases beyond 50%.
* The annotations highlight that a very high percentage of samples (99.7% at 25% and 99.9% at 50%) eventually achieve a correct answer.
### Interpretation
The chart demonstrates that while a large number of samples achieve a correct answer relatively quickly (within the first 20% of decoding steps), a substantial portion require more decoding steps to arrive at the correct solution. The diminishing returns observed beyond 50% decoding steps suggest that the initial decoding steps are the most crucial for achieving a correct answer. The annotations emphasize the high overall success rate, indicating that the decoding process is generally effective, but the time to reach a correct answer varies significantly across samples. The initial steep drop in samples suggests a potential bottleneck or difficulty in the early stages of decoding. This could be due to ambiguity in the initial data or the complexity of the decoding algorithm. The chart provides valuable insights into the efficiency and effectiveness of the decoding process, highlighting areas for potential optimization.