TECHNICAL ASSET FINGERPRINT
1badcd527816f1c0c0902fea
Click to view fullscreen
Press ESC or click to close
FOUND IN PAPERS
EXPERT: gemma-3-27b-it-free VERSION 1
RUNTIME: google-free/gemma-3-27b-it
INTEL_VERIFIED
## Complex Data Visualization: Movie Revenue & Genre Analysis
### Overview
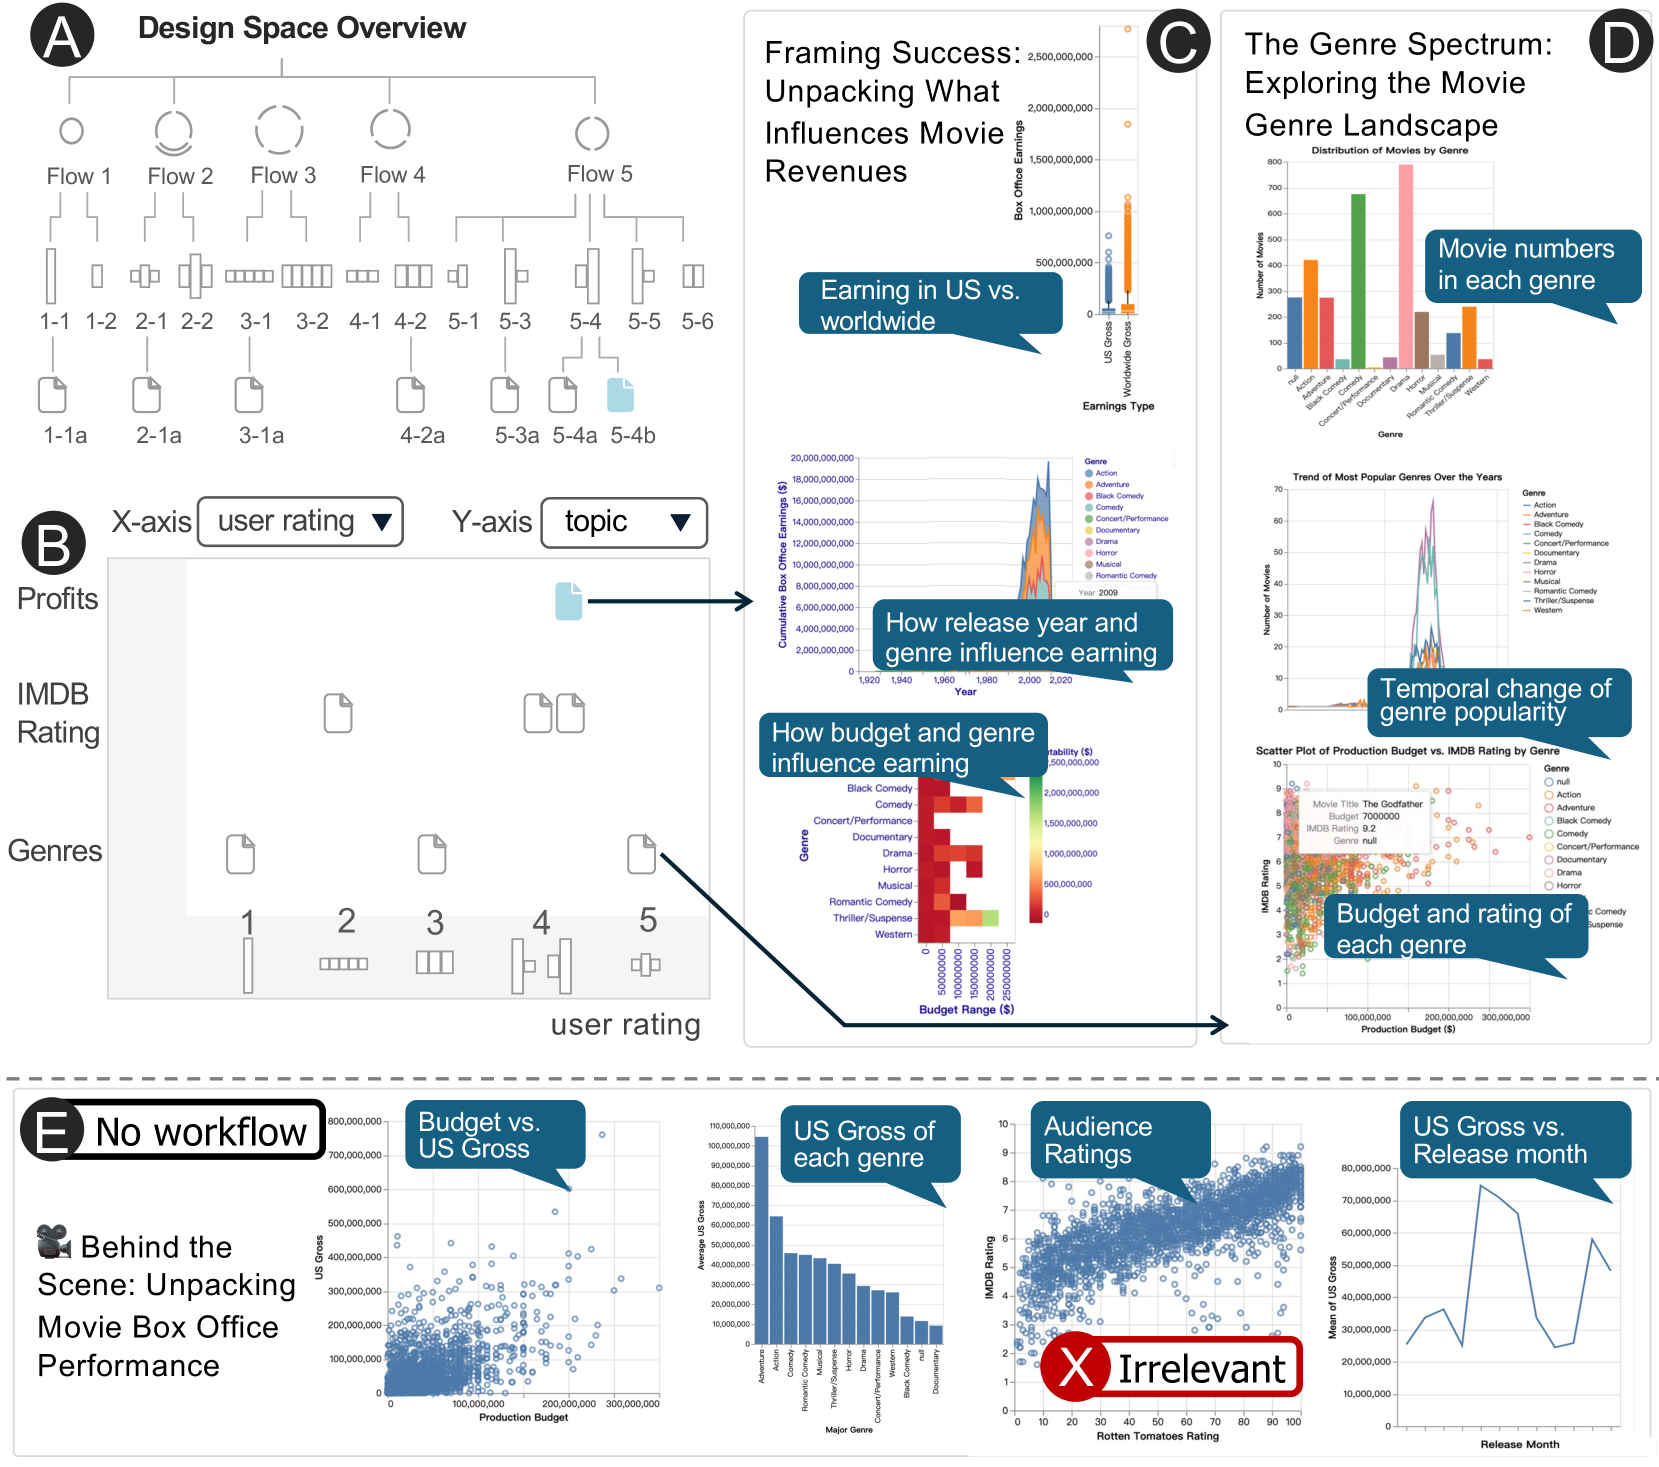
This image presents a multifaceted data visualization exploring the relationship between movie genre, budget, user rating, and revenue, primarily focusing on US vs. worldwide earnings. It combines several chart types – scatter plots, bar charts, flow diagrams, and distribution plots – to provide a comprehensive overview of these factors. The visualization is segmented into four main areas (A, B, C, and D) and a footer containing source information.
### Components/Axes
* **A: Design Space Overview:** A flow diagram with 5 flows (Flow 1 to Flow 5) and 6 stages (1-1 to 5-6). Each stage is represented by a box with varying internal structures.
* **B: Profits vs. IMDB Rating:** A scatter plot with "X-axis: user rating" and "Y-axis: topic". The plot displays data points representing movies, colored by genre. A horizontal line indicates a "No workflow" threshold.
* **C: The Genre Spectrum: Genre Landscape:** Contains multiple sub-charts:
* Distribution of movies by genre. X-axis: Genre. Y-axis: Number of Movies.
* Trend of most popular genres over the years. X-axis: Years. Y-axis: Number of Movies.
* Temporal change of genre popularity.
* Scatter plot of Production Budget vs. IMDB Rating by Genre. X-axis: Budget. Y-axis: IMDB Rating.
* **D: Framing Success: Unpacking What Influences Movie Revenues:** Contains multiple sub-charts:
* Earning in US vs. worldwide. X-axis: Earnings Type (US Gross vs. Worldwide Gross). Y-axis: Revenue (0 to 2,500,000,000).
* How release year and genre influence earning. X-axis: Year (0 to 2020). Y-axis: Revenue (0 to 2,500,000,000).
* How budget and genre influence earning. X-axis: Budget (0 to 100,000,000). Y-axis: Revenue (0 to 2,500,000,000).
* US gross of each genre. X-axis: Genre. Y-axis: US Gross (0 to 1,000,000,000).
* Worldwide gross of each genre. X-axis: Genre. Y-axis: Worldwide Gross (0 to 1,000,000,000).
* Average IMDB rating by genre. X-axis: Genre. Y-axis: Average IMDB Rating (0 to 8).
* **Legend:** Located in the bottom-right corner, associating colors with genres: Black Comedy, Concert/Performance, Crime, Documentary, Drama, Horror, Musical, Mystery, Romance, Sci-Fi, Thriller/Suspense.
* **Footer:** "Source: Box Office Mojo, Perspective: Data Visualization"
### Detailed Analysis or Content Details
**A: Design Space Overview**
The flow diagram shows a progression through stages. The internal structure of the boxes varies, suggesting different types of processes or data representations at each stage. The connections between stages are indicated by arrows.
**B: Profits vs. IMDB Rating**
The scatter plot shows a generally positive correlation between user rating and profits, but with significant scatter.
* **Black Comedy:** Approximately 5 data points, ranging from user rating of 3 to 7, and profits from 0 to 4.
* **Crime:** Approximately 8 data points, ranging from user rating of 2 to 8, and profits from 0 to 5.
* **Drama:** Approximately 10 data points, ranging from user rating of 2 to 8, and profits from 0 to 6.
* **Horror:** Approximately 6 data points, ranging from user rating of 3 to 7, and profits from 0 to 5.
* **Musical:** Approximately 3 data points, ranging from user rating of 4 to 6, and profits from 1 to 3.
* **Romance:** Approximately 7 data points, ranging from user rating of 3 to 7, and profits from 0 to 5.
* **Sci-Fi:** Approximately 8 data points, ranging from user rating of 3 to 8, and profits from 0 to 6.
* **Thriller/Suspense:** Approximately 9 data points, ranging from user rating of 3 to 8, and profits from 0 to 6.
The "No workflow" line appears to be around a profit level of 2.
**C: The Genre Spectrum: Genre Landscape**
* **Distribution of movies by genre:** Drama has the highest number of movies, followed by Thriller/Suspense and Sci-Fi.
* **Trend of most popular genres over the years:** The trend shows fluctuations in genre popularity over time, with Drama consistently being a popular genre.
* **Temporal change of genre popularity:** This plot shows the rise and fall of different genres over time.
* **Scatter plot of Production Budget vs. IMDB Rating by Genre:** There's a weak positive correlation between budget and IMDB rating.
**D: Framing Success: Unpacking What Influences Movie Revenues**
* **Earning in US vs. worldwide:** Worldwide gross is generally higher than US gross. The approximate values are: US Gross ~ 800,000,000, Worldwide Gross ~ 1,500,000,000.
* **How release year and genre influence earning:** Revenue generally increases with release year, but there are variations based on genre.
* **How budget and genre influence earning:** Higher budgets generally correlate with higher revenue, but the relationship varies by genre.
* **US gross of each genre:** Drama and Sci-Fi have the highest US gross.
* **Worldwide gross of each genre:** Drama and Sci-Fi have the highest worldwide gross.
* **Average IMDB rating by genre:** Romance and Musical have the highest average IMDB rating.
### Key Observations
* Drama consistently appears as a dominant genre across multiple charts (number of movies, revenue).
* There's a general positive correlation between budget and revenue, but it's not a strong relationship.
* Worldwide gross is consistently higher than US gross, indicating the importance of international markets.
* The scatter plot in section B suggests that higher user ratings generally correlate with higher profits, but there are many outliers.
* The "No workflow" line in section B suggests a threshold for profitability.
### Interpretation
This visualization aims to provide a holistic understanding of the factors influencing movie revenue. The data suggests that genre plays a significant role, with Drama being a consistently successful genre. Budget and user ratings also contribute to revenue, but their relationships are more complex and influenced by genre. The comparison between US and worldwide gross highlights the importance of international markets for maximizing revenue. The Design Space Overview (A) suggests a workflow or process for analyzing these factors, but the specific details of this process are not fully clear from the image. The visualization is a powerful tool for understanding the dynamics of the movie industry and identifying potential strategies for success. The multiple charts allow for a nuanced understanding of the data, revealing both general trends and specific outliers. The inclusion of genre as a key variable throughout the visualization emphasizes its importance in shaping movie performance.
DECODING INTELLIGENCE...