## Aerial Image with Object Detection Annotations: Bridge and Vehicle Analysis
### Overview
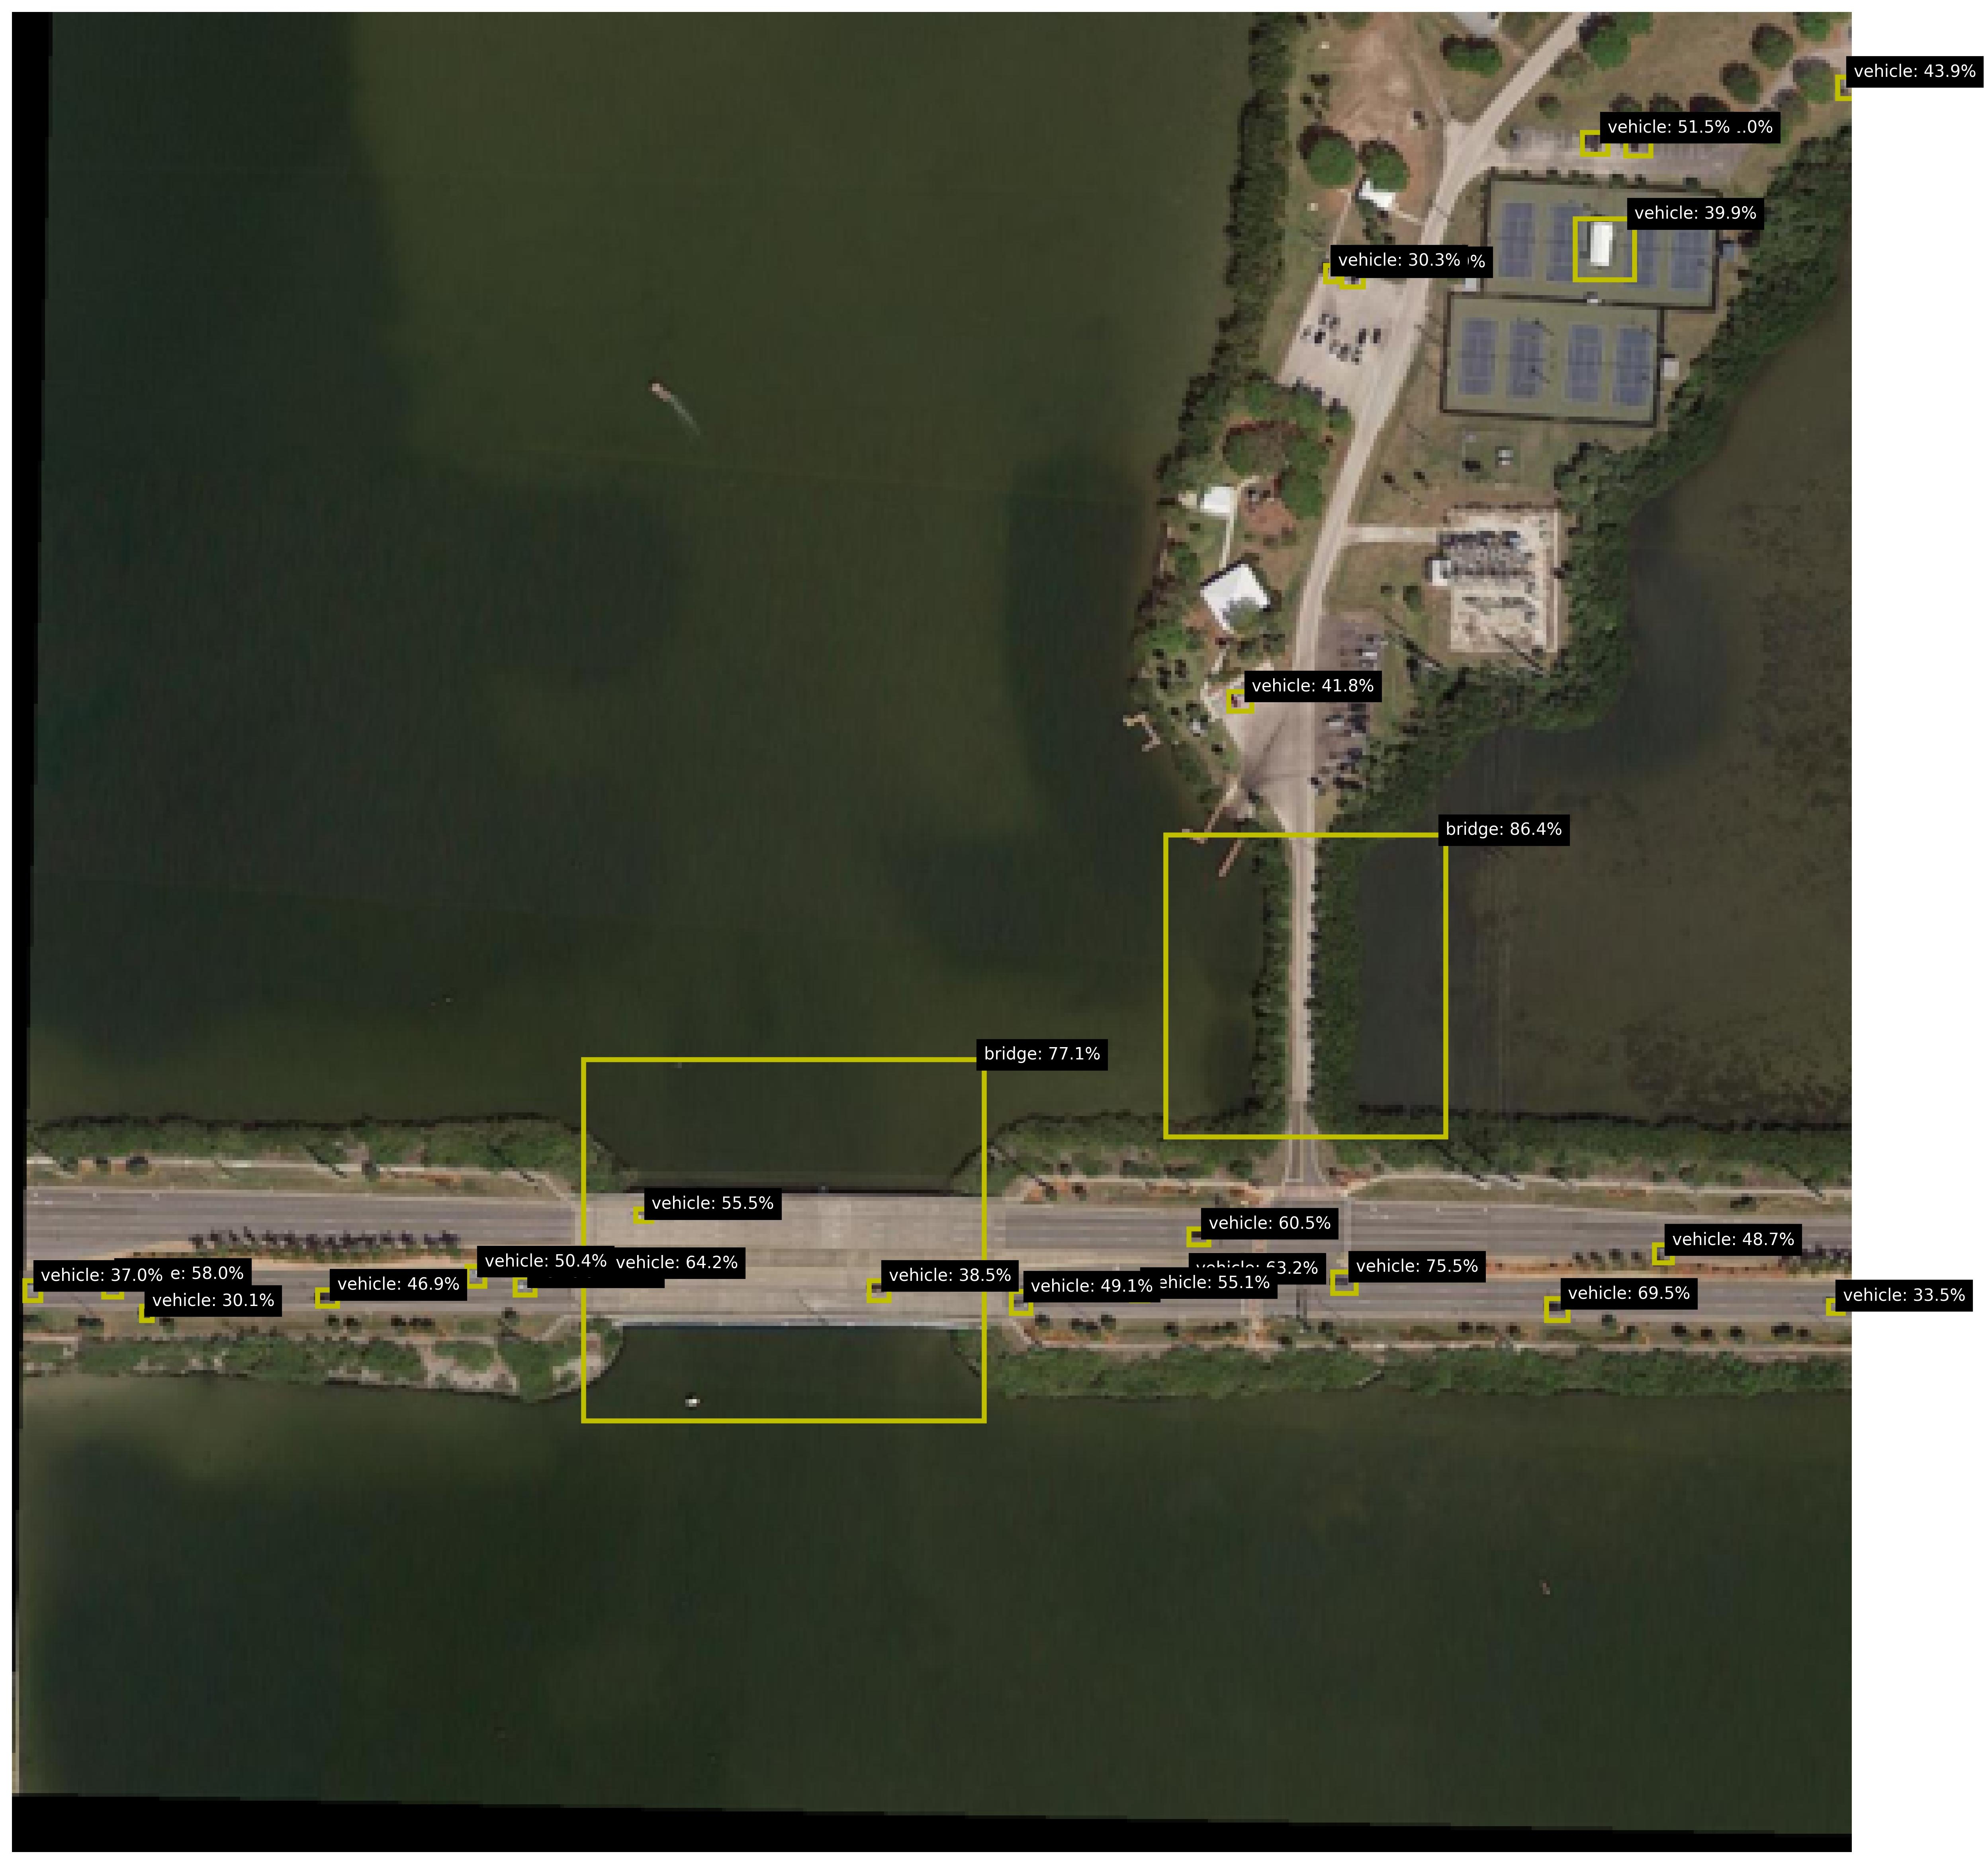
The image is an aerial view of a bridge spanning a body of water, with roads on either side. Vehicles are annotated along the roads and bridge with yellow bounding boxes and percentage labels. The bridge and vehicles are labeled with confidence scores (e.g., "bridge: 77.1%", "vehicle: 55.5%"). The water appears dark green, and the surrounding area includes vegetation, buildings, and infrastructure.
---
### Components/Axes
1. **Bridge**:
- Labeled with two confidence scores: **77.1%** and **86.4%**.
- Positioned centrally over the water, connecting two landmasses.
2. **Vehicles**:
- Annotated along roads on both sides of the bridge and on the bridge itself.
- Confidence scores range from **30.1%** to **75.5%**.
- Some annotations include secondary values (e.g., "vehicle: 37.0%: e: 58.0%").
3. **Roads**:
- Two parallel roads flank the bridge, with vehicles distributed along their lengths.
4. **Annotations**:
- Black text boxes with yellow outlines contain labels like "vehicle" or "bridge" followed by percentages.
- Positioned near detected objects (e.g., vehicles on roads, bridge structure).
---
### Detailed Analysis
- **Bridge**:
- Confidence scores: **77.1%** (lower-left annotation) and **86.4%** (upper-right annotation).
- Likely represents detection confidence for the bridge structure, with higher scores near the bridge's midpoint.
- **Vehicles**:
- **Left Road**:
- Scores: **37.0%**, **58.0%**, **30.1%**, **46.9%**, **50.4%**, **64.2%**.
- Vehicles clustered near the bridge's base.
- **Right Road**:
- Scores: **38.5%**, **49.1%**, **55.1%**, **69.5%**, **48.7%**, **33.5%**.
- Higher scores (e.g., **69.5%**) near the bridge's far end.
- **Bridge Surface**:
- Scores: **41.8%**, **55.5%**, **60.5%**, **75.5%**.
- Vehicles on the bridge show increasing confidence toward the far end.
- **Secondary Values**:
- Some annotations include additional metrics (e.g., "e: 58.0%"), possibly indicating error margins or secondary classifications.
---
### Key Observations
1. **Bridge Confidence**:
- The bridge's confidence scores (**77.1%**, **86.4%**) are consistently higher than most vehicle scores, suggesting the detection system prioritizes infrastructure over smaller objects.
2. **Vehicle Confidence Trends**:
- Vehicles near the bridge's base have lower scores (e.g., **30.1%**, **33.5%**), while those farther away show higher scores (e.g., **69.5%**, **75.5%**).
- Secondary values (e.g., "e: 58.0%") may reflect uncertainty in object classification or environmental factors.
3. **Spatial Distribution**:
- Vehicles are denser near the bridge, with fewer annotations on open road segments.
- The bridge's annotations are concentrated along its length, with higher scores toward the far end.
---
### Interpretation
1. **Object Detection System**:
- The annotations likely represent output from a computer vision model (e.g., YOLO, Faster R-CNN) analyzing traffic or infrastructure.
- Confidence scores indicate the model's certainty in detecting bridges and vehicles.
2. **Performance Insights**:
- The bridge's high confidence scores suggest robust detection of large, static structures.
- Vehicle scores vary, possibly due to factors like occlusion, distance, or lighting conditions.
3. **Anomalies**:
- The secondary values (e.g., "e: 58.0%") lack clear context but may represent error rates or alternative classifications (e.g., vehicle type).
4. **Practical Implications**:
- This data could be used for traffic monitoring, infrastructure assessment, or autonomous vehicle navigation systems.
---
### Spatial Grounding
- **Bridge Annotations**: Centered over the bridge structure, with labels near the midpoint and far end.
- **Vehicle Annotations**:
- Left Road: Bottom-left quadrant.
- Right Road: Bottom-right quadrant.
- Bridge Surface: Along the bridge's length, with higher scores toward the far end.
- **Legend**: No explicit legend, but annotations act as de facto labels with confidence scores.
---
### Trend Verification
- **Bridge**: Confidence increases from **77.1%** to **86.4%** along its length.
- **Vehicles**: Scores generally rise from lower (near bridge base) to higher (farther from bridge), with outliers like **30.1%** and **33.5%**.
- **Secondary Metrics**: Inconsistent presence (e.g., "e: 58.0%") suggests optional or conditional annotations.
---
### Conclusion
The image demonstrates an object detection system's performance in identifying bridges and vehicles from an aerial perspective. The bridge's high confidence scores contrast with variable vehicle detection accuracy, highlighting challenges in detecting smaller or dynamically positioned objects. Secondary metrics and spatial trends suggest opportunities for model refinement, such as improving low-confidence detections near infrastructure or clarifying ambiguous annotations.