## Bar Chart: Model Performance on Different Datasets
### Overview
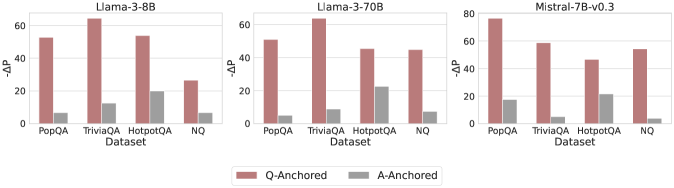
The image presents three bar charts comparing the performance of different language models (Llama-3-8B, Llama-3-70B, and Mistral-7B-v0.3) across four datasets (PopQA, TriviaQA, HotpotQA, and NQ). The y-axis represents "-ΔP", and the bars are colored to distinguish between "Q-Anchored" and "A-Anchored" performance.
### Components/Axes
* **Titles:**
* Left Chart: Llama-3-8B
* Middle Chart: Llama-3-70B
* Right Chart: Mistral-7B-v0.3
* **X-Axis:** Dataset (PopQA, TriviaQA, HotpotQA, NQ)
* **Y-Axis:** -ΔP, with a scale from 0 to 80 in increments of 20.
* **Legend:** Located at the bottom of the image.
* Rose/Pink: Q-Anchored
* Gray: A-Anchored
### Detailed Analysis
**Chart 1: Llama-3-8B**
* **PopQA:**
* Q-Anchored (Rose/Pink): ~52
* A-Anchored (Gray): ~7
* **TriviaQA:**
* Q-Anchored (Rose/Pink): ~64
* A-Anchored (Gray): ~12
* **HotpotQA:**
* Q-Anchored (Rose/Pink): ~53
* A-Anchored (Gray): ~20
* **NQ:**
* Q-Anchored (Rose/Pink): ~27
* A-Anchored (Gray): ~7
**Chart 2: Llama-3-70B**
* **PopQA:**
* Q-Anchored (Rose/Pink): ~52
* A-Anchored (Gray): ~8
* **TriviaQA:**
* Q-Anchored (Rose/Pink): ~63
* A-Anchored (Gray): ~9
* **HotpotQA:**
* Q-Anchored (Rose/Pink): ~45
* A-Anchored (Gray): ~22
* **NQ:**
* Q-Anchored (Rose/Pink): ~45
* A-Anchored (Gray): ~8
**Chart 3: Mistral-7B-v0.3**
* **PopQA:**
* Q-Anchored (Rose/Pink): ~75
* A-Anchored (Gray): ~17
* **TriviaQA:**
* Q-Anchored (Rose/Pink): ~57
* A-Anchored (Gray): ~5
* **HotpotQA:**
* Q-Anchored (Rose/Pink): ~46
* A-Anchored (Gray): ~21
* **NQ:**
* Q-Anchored (Rose/Pink): ~54
* A-Anchored (Gray): ~3
### Key Observations
* For all models, Q-Anchored performance is generally higher than A-Anchored performance across all datasets.
* TriviaQA tends to have the highest Q-Anchored performance for Llama-3-8B and Llama-3-70B.
* Mistral-7B-v0.3 shows the highest Q-Anchored performance on PopQA.
* A-Anchored performance is consistently low across all datasets and models, with HotpotQA showing slightly higher values.
### Interpretation
The charts illustrate the performance differences between language models on various question-answering datasets, distinguishing between Q-Anchored and A-Anchored approaches. The consistently higher Q-Anchored performance suggests that anchoring the model on the question leads to better results compared to anchoring on the answer. The specific performance variations across datasets highlight the models' strengths and weaknesses in handling different types of questions and knowledge domains. Mistral-7B-v0.3 appears to perform better overall, especially on the PopQA dataset. The low A-Anchored performance indicates a potential area for improvement in how the models utilize answer-related information.