\n
## Chart: Receiver Operating Characteristic (ROC) Curves
### Overview
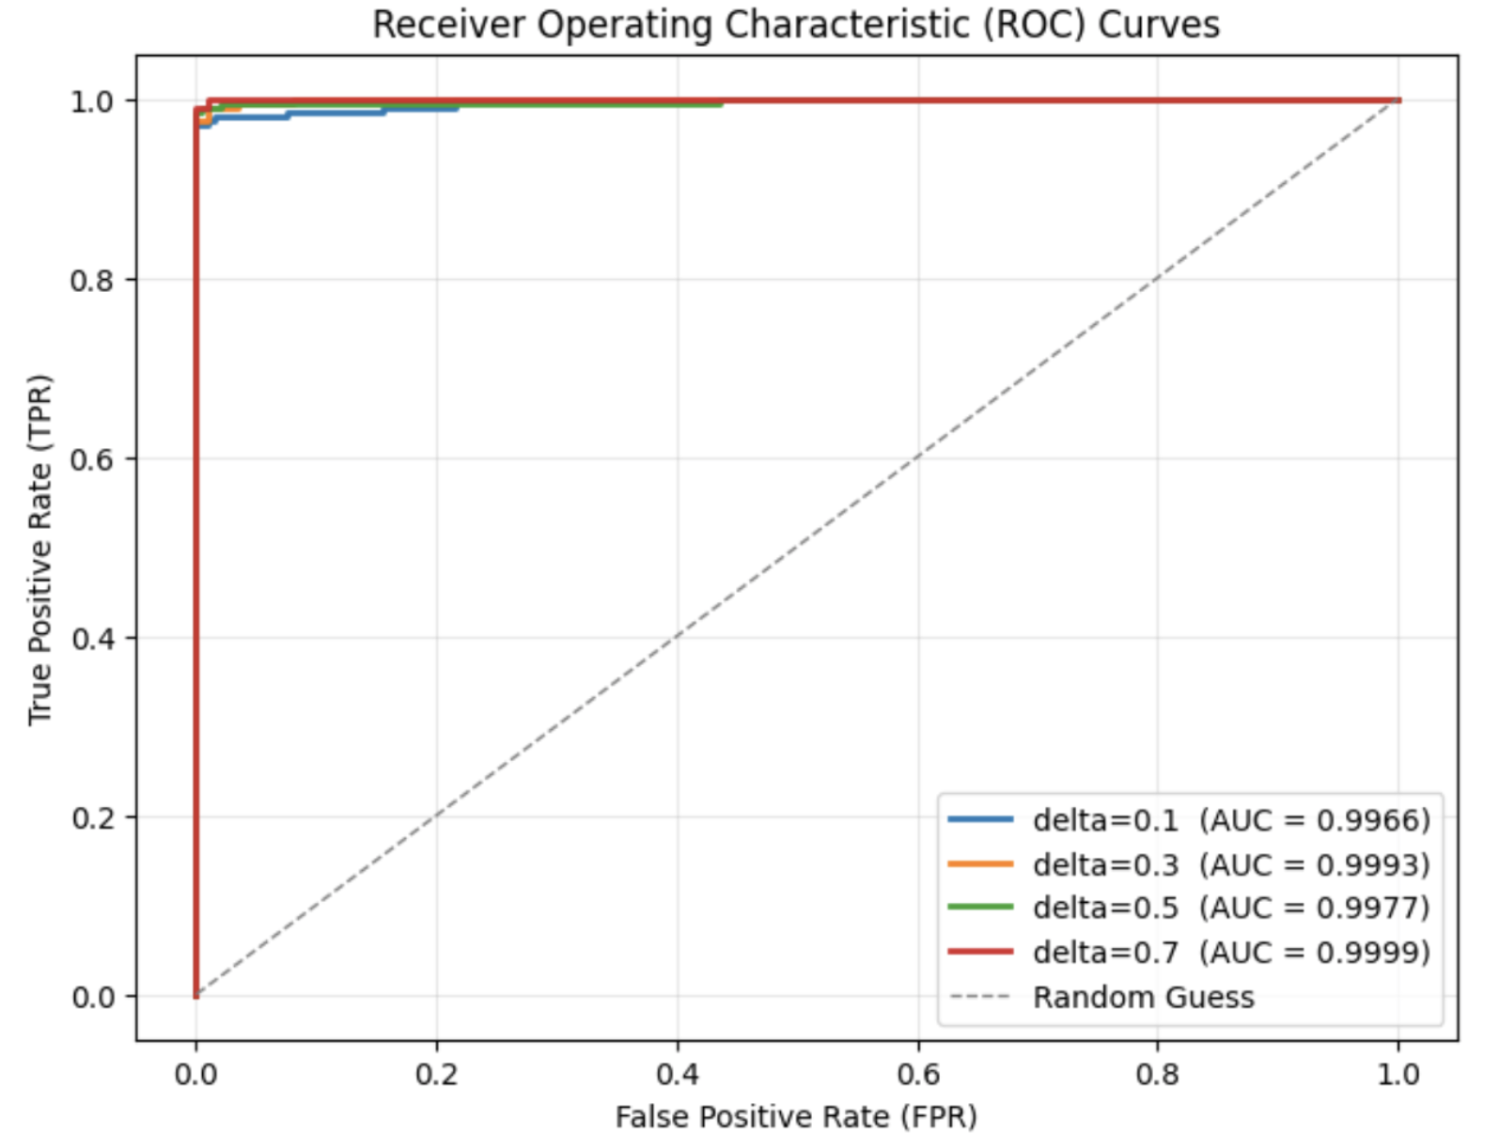
The image displays Receiver Operating Characteristic (ROC) curves for four different delta values (0.1, 0.3, 0.5, and 0.7). The curves plot True Positive Rate (TPR) against False Positive Rate (FPR), and are used to evaluate the performance of a binary classification model at various threshold settings. A diagonal dashed line represents the performance of a random guess. The Area Under the Curve (AUC) is provided for each delta value.
### Components/Axes
* **Title:** Receiver Operating Characteristic (ROC) Curves
* **X-axis:** False Positive Rate (FPR) - Scale: 0.0 to 1.0
* **Y-axis:** True Positive Rate (TPR) - Scale: 0.0 to 1.0
* **Legend:** Located in the top-right corner. Contains the following entries:
* Blue Solid Line: delta=0.1 (AUC = 0.9966)
* Orange Solid Line: delta=0.3 (AUC = 0.9993)
* Green Solid Line: delta=0.5 (AUC = 0.9977)
* Red Solid Line: delta=0.7 (AUC = 0.9999)
* Gray Dashed Line: Random Guess
### Detailed Analysis
The chart shows four ROC curves, each corresponding to a different delta value. The "Random Guess" line is a diagonal line from the bottom-left to the top-right corner.
* **delta=0.1 (Blue Line):** The curve starts at approximately (0.0, 1.0) and quickly descends to approximately (0.05, 0.95), then plateaus around (0.1, 0.9).
* **delta=0.3 (Orange Line):** This curve is very close to the top-left corner, indicating excellent performance. It starts at (0.0, 1.0) and remains close to TPR=1.0 until FPR reaches approximately 0.1, then descends slightly.
* **delta=0.5 (Green Line):** Similar to delta=0.3, this curve also demonstrates high performance. It starts at (0.0, 1.0) and remains close to TPR=1.0 until FPR reaches approximately 0.05, then descends slightly.
* **delta=0.7 (Red Line):** This curve is nearly identical to the delta=0.3 curve, indicating extremely high performance. It starts at (0.0, 1.0) and remains close to TPR=1.0 until FPR reaches approximately 0.02, then descends slightly.
* **Random Guess (Gray Dashed Line):** This line represents the performance of a classifier that randomly guesses the class label. It runs from (0.0, 0.0) to (1.0, 1.0).
### Key Observations
* All four delta values demonstrate significantly better performance than random guessing, as their ROC curves are well above the diagonal "Random Guess" line.
* The AUC values are all very high (between 0.9966 and 0.9999), indicating excellent discrimination ability.
* Delta values of 0.3 and 0.7 exhibit the highest AUC scores (0.9993 and 0.9999 respectively), suggesting they provide the best separation between positive and negative classes.
* The curves for delta=0.3, 0.5, and 0.7 are very close to each other, indicating similar performance.
### Interpretation
The ROC curves demonstrate that the binary classification model performs very well across all tested delta values. The high AUC values suggest that the model is capable of effectively distinguishing between positive and negative classes. The curves for delta=0.3 and 0.7 are particularly strong, indicating that these values may be optimal for the model's performance. The fact that all curves are significantly above the random guess line confirms the model's predictive power. The curves show that the model achieves a high true positive rate even with a low false positive rate, which is desirable in many applications. The slight differences in the curves suggest that the choice of delta value can influence the model's performance, but overall, the model is robust and reliable.