## Scatter Plot: Genre Distribution Analysis
### Overview
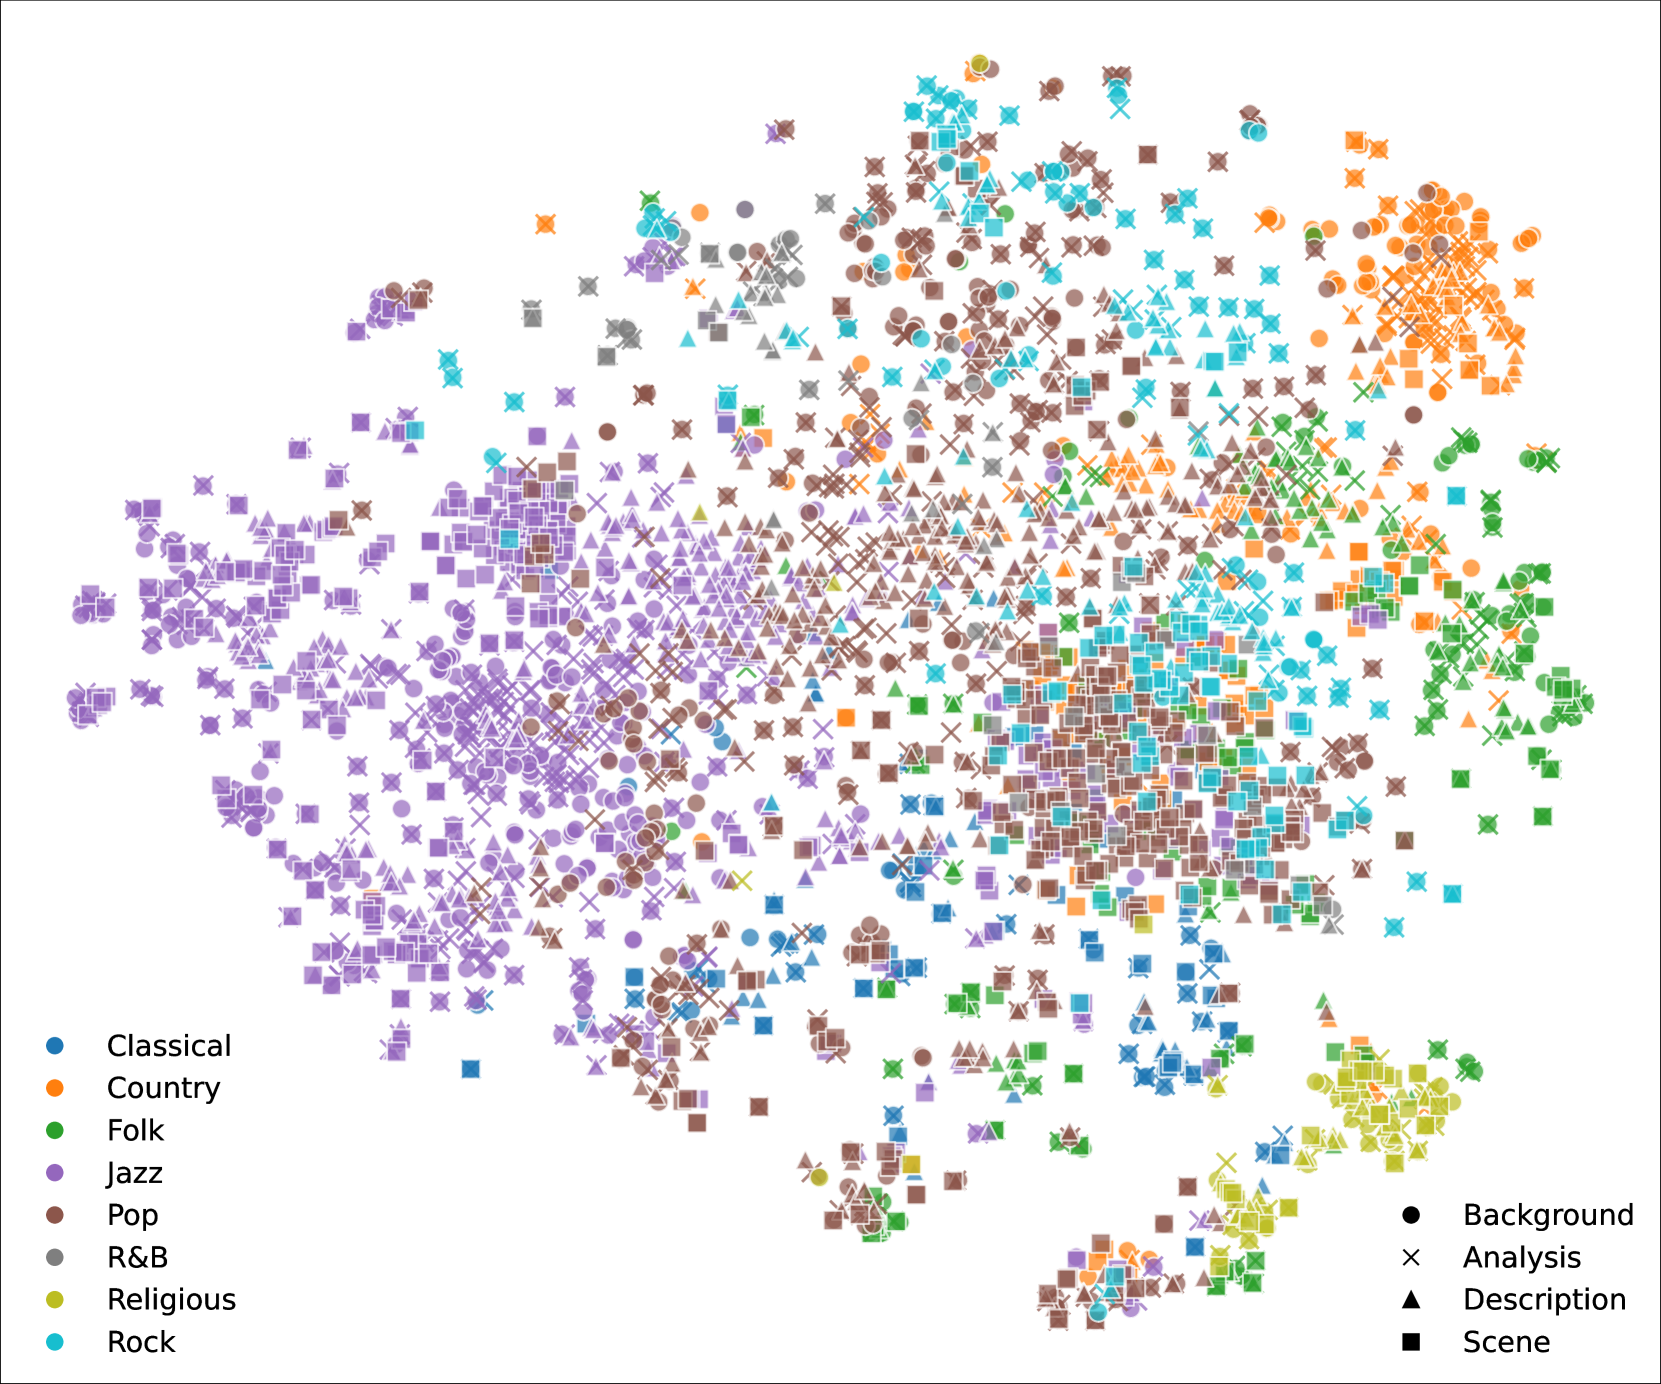
The image is a scatter plot visualizing the distribution of music genres across a two-dimensional space. Each genre is represented by a distinct color, and data points within each genre are differentiated by symbols (circles, crosses, triangles, squares). The plot lacks labeled axes but includes a legend on the left side, which maps colors to genres and symbols to data categories (Background, Analysis, Description, Scene). The distribution shows dense clusters for certain genres and sparse representation for others, with overlapping symbols in the central region.
---
### Components/Axes
- **Legend**: Located on the left side of the plot.
- **Colors**:
- Blue: Classical
- Orange: Country
- Green: Folk
- Purple: Jazz
- Brown: Pop
- Gray: R&B
- Yellow: Religious
- Cyan: Rock
- **Symbols**:
- Circle: Background
- Cross: Analysis
- Triangle: Description
- Square: Scene
- **Axes**: No explicit labels or scales are visible. The x- and y-axes appear to represent abstract or normalized dimensions (e.g., thematic or stylistic axes).
---
### Detailed Analysis
1. **Genre Distribution**:
- **Pop (Brown)**: Dominates the plot with the highest density of symbols (circles, crosses, triangles, squares).
- **Rock (Cyan)**: Second-most prevalent, with dense clusters of crosses and squares.
- **Jazz (Purple)**: Moderate density, primarily circles and triangles.
- **Country (Orange)**: Concentrated in the upper-right quadrant, with crosses and squares.
- **Folk (Green)**: Sparse but clustered in the lower-right quadrant, with circles and triangles.
- **Classical (Blue)**: Scattered symbols, mostly circles and crosses.
- **R&B (Gray)**: Moderate density, with crosses and triangles.
- **Religious (Yellow)**: Least dense, with circles and squares in the lower-left quadrant.
2. **Symbol Trends**:
- **Background (Circles)**: Most common across all genres, suggesting foundational data points.
- **Analysis (Crosses)**: Predominant in Rock, Country, and Pop.
- **Description (Triangles)**: Most frequent in Jazz and R&B.
- **Scene (Squares)**: Concentrated in Pop, Rock, and Religious genres.
3. **Overlap**:
- Central region shows overlapping symbols from multiple genres, indicating shared or hybrid data points (e.g., cross-genre analyses or descriptions).
---
### Key Observations
- **Density Variance**: Pop and Rock genres have the highest number of data points, while Religious and Classical have the fewest.
- **Symbol Dominance**: Crosses (Analysis) and circles (Background) are the most widespread symbols.
- **Spatial Clustering**:
- Pop and Rock dominate the central and upper regions.
- Folk and Religious genres are isolated in the lower-right and lower-left quadrants, respectively.
- **Ambiguity**: Lack of axis labels prevents quantitative interpretation of trends.
---
### Interpretation
The plot suggests a focus on analyzing and describing Pop and Rock genres, as evidenced by their high density of "Analysis" (crosses) and "Scene" (squares) symbols. Jazz and R&B emphasize descriptive elements (triangles), while Folk and Religious genres are underrepresented overall. The central overlap implies potential cross-genre influences or hybrid data points, though the absence of axis labels limits precise interpretation. The use of distinct symbols per data category allows for granular analysis of how different aspects (e.g., background vs. scene) are prioritized across genres.
**Notable Outlier**: Religious genre’s sparse representation contrasts with its symbolic presence in the lower-left quadrant, possibly indicating niche or specialized data collection.