\n
## Bar Chart: Distribution of Max Triple Overlap
### Overview
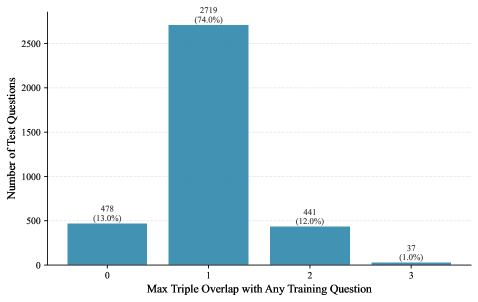
The image presents a bar chart illustrating the distribution of the maximum triple overlap between test questions and training questions. The x-axis represents the degree of overlap (0, 1, 2, 3), and the y-axis represents the number of test questions. Each bar is labeled with its corresponding count and percentage of the total.
### Components/Axes
* **X-axis Title:** "Max Triple Overlap with Any Training Question"
* **Y-axis Title:** "Number of Test Questions"
* **X-axis Markers:** 0, 1, 2, 3
* **Y-axis Scale:** 0 to 2700, incrementing by 500.
* **Bars:** Four bars representing the counts for each overlap value.
* **Labels:** Each bar is labeled with its count and percentage in parentheses.
### Detailed Analysis
The chart shows a highly skewed distribution.
* **Overlap 0:** 478 test questions (13.0%)
* **Overlap 1:** 2719 test questions (74.0%)
* **Overlap 2:** 441 test questions (12.0%)
* **Overlap 3:** 37 test questions (1.0%)
The bar corresponding to an overlap of 1 is significantly taller than the others, indicating that the majority of test questions have a maximum triple overlap of 1 with any training question. The number of questions decreases as the overlap value increases beyond 1.
### Key Observations
* The distribution is heavily concentrated at an overlap of 1.
* There is a steep drop in the number of questions as the overlap increases from 1 to 2, and again from 2 to 3.
* The number of questions with no overlap (0) is relatively small compared to the others.
### Interpretation
The data suggests that the test questions are designed to have limited overlap with the training questions, but a substantial portion (74%) share some degree of triple overlap. This could be intentional, perhaps to assess generalization ability rather than rote memorization. The sharp decline in overlap beyond 1 indicates a deliberate effort to minimize redundancy between the test and training sets. The small number of questions with an overlap of 3 suggests that the test questions are largely distinct from the training questions. The overlap metric, "Max Triple Overlap", is not defined in the image, but it appears to be a measure of similarity between test and training questions. It is likely that a higher overlap value indicates a greater degree of similarity. The fact that most questions have an overlap of 1 suggests that there is some shared information, but not a large amount.