\n
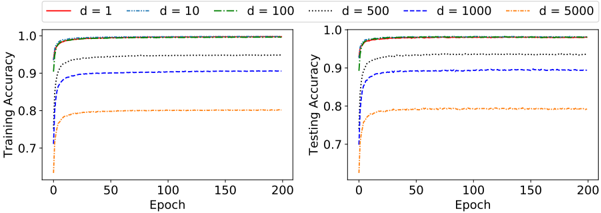
## Line Chart: Training and Testing Accuracy vs. Epoch for Different 'd' Values
### Overview
The image presents two line charts displayed side-by-side. The left chart shows Training Accuracy versus Epoch, while the right chart shows Testing Accuracy versus Epoch. Both charts depict the performance of a model trained over 200 epochs for different values of a parameter 'd' (1, 10, 100, 500, 1000, and 5000). The lines represent the accuracy achieved for each 'd' value.
### Components/Axes
* **X-axis (Both Charts):** Epoch, ranging from 0 to 200.
* **Y-axis (Left Chart):** Training Accuracy, ranging from approximately 0.7 to 1.1.
* **Y-axis (Right Chart):** Testing Accuracy, ranging from approximately 0.7 to 1.1.
* **Legend (Top-Center):** Indicates the different values of 'd' and their corresponding line styles and colors:
* d = 1 (Solid Red Line)
* d = 10 (Dashed Blue Line)
* d = 100 (Dotted Gray Line)
* d = 500 (Dash-Dot Green Line)
* d = 1000 (Dashed Green Line)
* d = 5000 (Dotted Green Line)
### Detailed Analysis or Content Details
**Left Chart (Training Accuracy):**
* **d = 1 (Red):** The line starts at approximately 0.78 and rapidly increases to around 0.98 by epoch 50, then plateaus around 1.0.
* **d = 10 (Blue):** The line starts at approximately 0.85 and increases more slowly than d=1, reaching around 0.95 by epoch 50, and then plateaus around 0.97.
* **d = 100 (Gray):** The line starts at approximately 0.88 and increases steadily, reaching around 0.97 by epoch 50, and then plateaus around 1.0.
* **d = 500 (Green):** The line starts at approximately 0.89 and increases rapidly, reaching around 0.99 by epoch 50, and then plateaus around 1.0.
* **d = 1000 (Green):** The line starts at approximately 0.89 and increases rapidly, reaching around 0.99 by epoch 50, and then plateaus around 1.0.
* **d = 5000 (Green):** The line starts at approximately 0.89 and increases rapidly, reaching around 0.99 by epoch 50, and then plateaus around 1.0.
**Right Chart (Testing Accuracy):**
* **d = 1 (Red):** The line starts at approximately 0.78 and rapidly increases to around 0.95 by epoch 50, then plateaus around 1.0.
* **d = 10 (Blue):** The line starts at approximately 0.85 and increases more slowly than d=1, reaching around 0.92 by epoch 50, and then plateaus around 0.94.
* **d = 100 (Gray):** The line starts at approximately 0.88 and increases steadily, reaching around 0.95 by epoch 50, and then plateaus around 0.97.
* **d = 500 (Green):** The line starts at approximately 0.89 and increases rapidly, reaching around 0.98 by epoch 50, and then plateaus around 1.0.
* **d = 1000 (Green):** The line starts at approximately 0.89 and increases rapidly, reaching around 0.98 by epoch 50, and then plateaus around 1.0.
* **d = 5000 (Green):** The line starts at approximately 0.89 and increases rapidly, reaching around 0.98 by epoch 50, and then plateaus around 1.0.
### Key Observations
* For both training and testing accuracy, higher values of 'd' (500, 1000, 5000) generally lead to faster convergence and higher accuracy.
* The lines for d=500, d=1000, and d=5000 are nearly indistinguishable in both charts, suggesting that increasing 'd' beyond 500 provides diminishing returns.
* There is a noticeable gap between the training and testing accuracy, indicating some degree of overfitting, especially for lower values of 'd'.
* The model with d=1 exhibits the slowest learning rate and the lowest final accuracy.
### Interpretation
The data suggests that the parameter 'd' plays a crucial role in the model's performance. Increasing 'd' initially improves both training and testing accuracy, likely by increasing the model's capacity to learn complex patterns. However, beyond a certain point (around d=500), further increases in 'd' do not significantly improve performance, and may even lead to overfitting.
The difference between training and testing accuracy indicates that the model is learning the training data too well, and is not generalizing well to unseen data. This is a common problem in machine learning, and can be addressed by techniques such as regularization or early stopping.
The charts provide valuable insights into the relationship between the parameter 'd' and the model's performance, and can be used to guide the selection of an appropriate value for 'd' during model training. The fact that d=500, d=1000, and d=5000 perform similarly suggests that computational cost should be considered when choosing a value for 'd'.