## Bar Chart: Ratios of Failed Problems of Base Model, SFT Model, and Initial RL Model in MATH-12k
### Overview
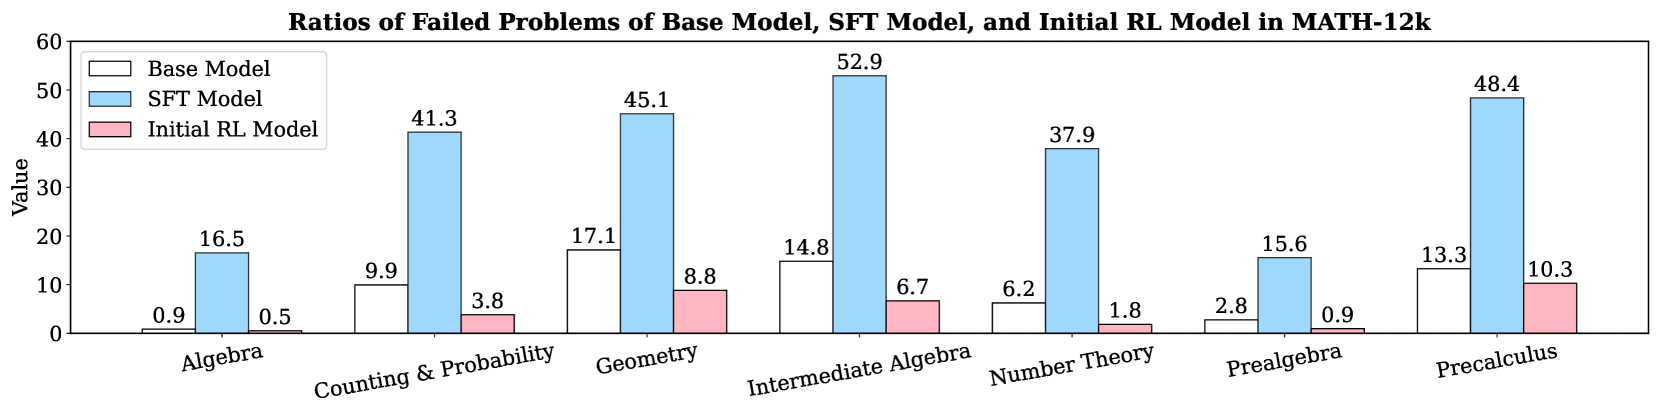
The image is a bar chart comparing the ratios of failed problems for three different models (Base Model, SFT Model, and Initial RL Model) across seven mathematical topics within the MATH-12k dataset. The y-axis represents the "Value" (ratio), and the x-axis represents the mathematical topics.
### Components/Axes
* **Title:** Ratios of Failed Problems of Base Model, SFT Model, and Initial RL Model in MATH-12k
* **Y-axis:**
* Label: Value
* Scale: 0 to 60, with tick marks at intervals of 10 (0, 10, 20, 30, 40, 50, 60)
* **X-axis:**
* Categories: Algebra, Counting & Probability, Geometry, Intermediate Algebra, Number Theory, Prealgebra, Precalculus
* **Legend:** Located in the top-left corner.
* Base Model: White bar with black outline
* SFT Model: Light blue bar with black outline
* Initial RL Model: Light pink bar with black outline
### Detailed Analysis
Here's a breakdown of the values for each model across the different mathematical topics:
* **Algebra:**
* Base Model: 0.9
* SFT Model: 16.5
* Initial RL Model: 0.5
* **Counting & Probability:**
* Base Model: 9.9
* SFT Model: 41.3
* Initial RL Model: 3.8
* **Geometry:**
* Base Model: 17.1
* SFT Model: 45.1
* Initial RL Model: 8.8
* **Intermediate Algebra:**
* Base Model: 14.8
* SFT Model: 52.9
* Initial RL Model: 6.7
* **Number Theory:**
* Base Model: 6.2
* SFT Model: 37.9
* Initial RL Model: 1.8
* **Prealgebra:**
* Base Model: 2.8
* SFT Model: 15.6
* Initial RL Model: 0.9
* **Precalculus:**
* Base Model: 13.3
* SFT Model: 48.4
* Initial RL Model: 10.3
### Key Observations
* The SFT Model consistently has a higher ratio of failed problems compared to the Base Model and Initial RL Model across all mathematical topics.
* The Initial RL Model generally has the lowest ratio of failed problems.
* The highest failure rate for the SFT model is in Intermediate Algebra (52.9).
* The lowest failure rate for the SFT model is in Prealgebra (15.6).
### Interpretation
The bar chart illustrates the performance differences between the Base Model, SFT Model, and Initial RL Model in solving problems from the MATH-12k dataset. The SFT Model exhibits a significantly higher failure rate across all topics, suggesting it struggles more with these problems compared to the other two models. The Initial RL Model consistently outperforms the other models, indicating its effectiveness in solving these mathematical problems. The specific mathematical topics seem to influence the failure rates, with Intermediate Algebra being particularly challenging for the SFT Model. The data suggests that the SFT model may require further refinement or a different approach to improve its problem-solving capabilities in the MATH-12k dataset.