\n
## Bar Chart: Ratios of Failed Problems of Base Model, SFT Model, and Initial RL Model in MATH-12k
### Overview
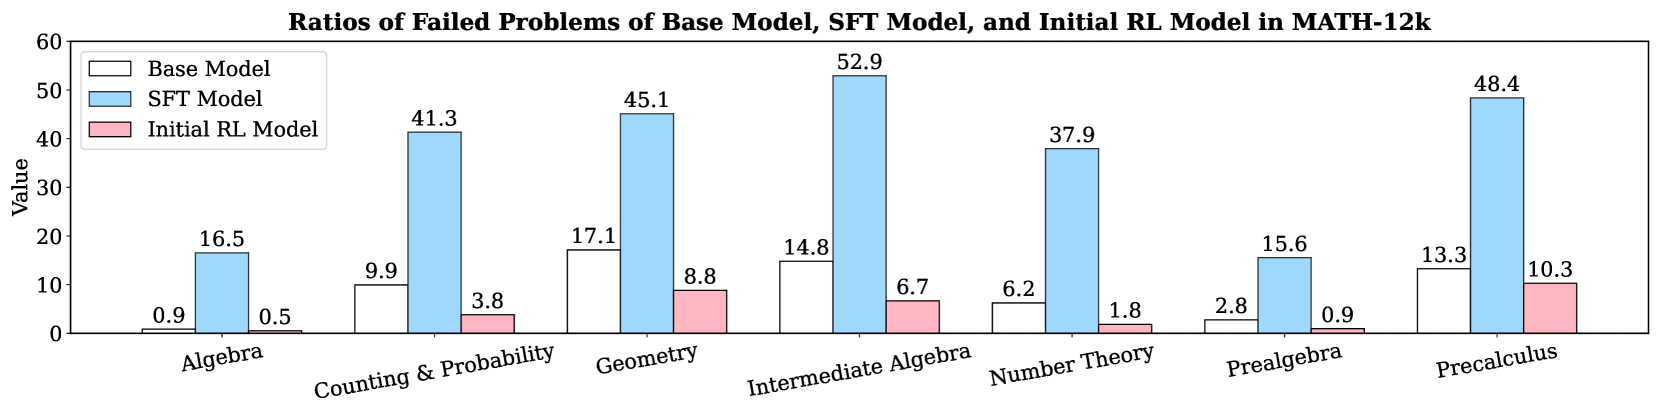
This bar chart compares the ratios of failed problems for three different models – Base Model, SFT Model, and Initial RL Model – across eight different mathematical subjects within the MATH-12k dataset. The y-axis represents the ratio of failed problems (Value), and the x-axis represents the mathematical subjects. Each subject has three bars representing the failure rate of each model.
### Components/Axes
* **Title:** "Ratios of Failed Problems of Base Model, SFT Model, and Initial RL Model in MATH-12k" (Top-center)
* **X-axis Label:** Mathematical Subjects (Bottom-center)
* Categories: Algebra, Counting & Probability, Geometry, Intermediate Algebra, Number Theory, Prealgebra, Precalculus
* **Y-axis Label:** Value (Left-center)
* Scale: 0 to 60, with increments of 10.
* **Legend:** (Top-left)
* Base Model: Light Blue
* SFT Model: Medium Blue
* Initial RL Model: Light Red
### Detailed Analysis
The chart consists of eight groups of three bars, one for each model within each subject.
* **Algebra:**
* Base Model: Approximately 0.9
* SFT Model: Approximately 16.5
* Initial RL Model: Approximately 0.5
* **Counting & Probability:**
* Base Model: Approximately 9.9
* SFT Model: Approximately 41.3
* Initial RL Model: Approximately 3.8
* **Geometry:**
* Base Model: Approximately 17.1
* SFT Model: Approximately 45.1
* Initial RL Model: Approximately 8.8
* **Intermediate Algebra:**
* Base Model: Approximately 14.8
* SFT Model: Approximately 52.9
* Initial RL Model: Approximately 6.7
* **Number Theory:**
* Base Model: Approximately 6.2
* SFT Model: Approximately 37.9
* Initial RL Model: Approximately 1.8
* **Prealgebra:**
* Base Model: Approximately 2.8
* SFT Model: Approximately 15.6
* Initial RL Model: Approximately 0.9
* **Precalculus:**
* Base Model: Approximately 13.3
* SFT Model: Approximately 48.4
* Initial RL Model: Approximately 10.3
**Trends:**
* The SFT Model consistently exhibits the highest failure rates across all subjects. The bars for the SFT model are the tallest in each group.
* The Initial RL Model generally has the lowest failure rates, with the shortest bars in each group.
* The Base Model's failure rates are intermediate, falling between the SFT and Initial RL Models.
* Intermediate Algebra shows the highest failure rate for the SFT model, reaching approximately 52.9.
* Number Theory shows the lowest failure rate for the SFT model, reaching approximately 37.9.
### Key Observations
* The SFT model performs significantly worse than the other two models across all categories.
* The Initial RL model consistently performs the best.
* The failure rates vary considerably across different mathematical subjects. Intermediate Algebra is the most challenging subject for the SFT model, while Number Theory is the least challenging.
### Interpretation
The data suggests that the SFT model, while potentially more capable in some areas, struggles with the MATH-12k dataset compared to the Base Model and Initial RL Model. The consistently higher failure rates of the SFT model indicate that it may be overfitting to certain types of problems or lacking in generalization ability. The Initial RL model's consistently low failure rates suggest it is robust and well-suited to the dataset. The variation in failure rates across subjects highlights the different levels of difficulty within the MATH-12k dataset. The chart provides valuable insights into the strengths and weaknesses of each model, which can inform future model development and training strategies. The large differences in performance between the SFT model and the others suggest a potential issue with the SFT training process or data. Further investigation into the training data and methodology of the SFT model is warranted.