## Grouped Bar Chart: Ratios of Failed Problems by Model and Math Category
### Overview
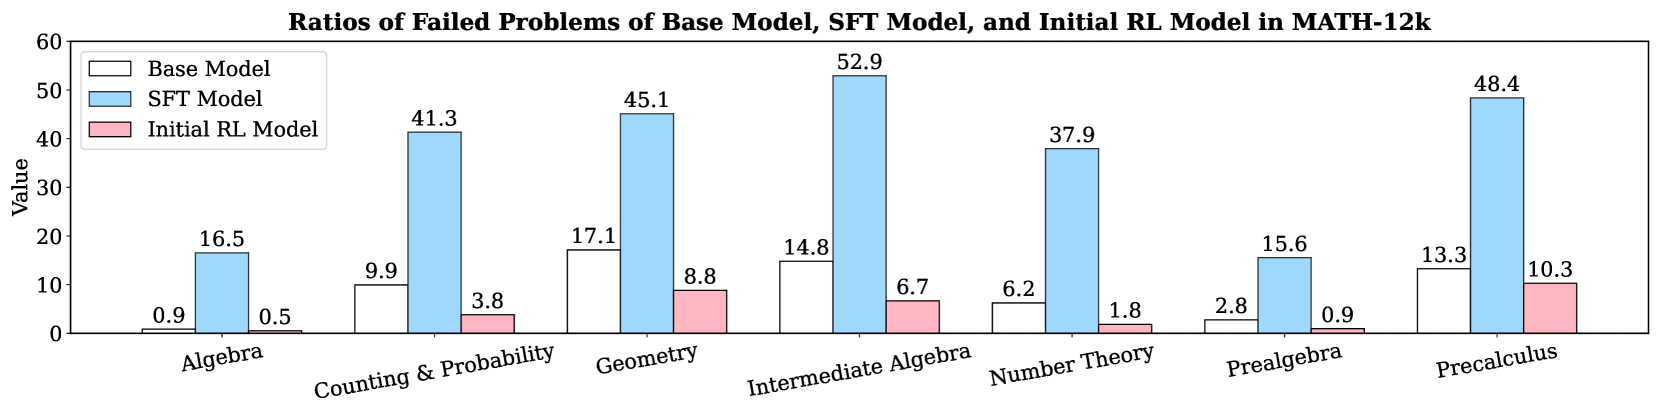
This is a grouped bar chart titled "Ratios of Failed Problems of Base Model, SFT Model, and Initial RL Model in MATH-12k". It compares the failure rates (as a numerical value, likely a percentage) of three different AI models across seven distinct mathematical subject categories. The chart visually demonstrates how model performance, in terms of problem failure, varies by subject area and training methodology.
### Components/Axes
* **Chart Title:** "Ratios of Failed Problems of Base Model, SFT Model, and Initial RL Model in MATH-12k"
* **Y-Axis:**
* **Label:** "Value"
* **Scale:** Linear scale from 0 to 60, with major tick marks at intervals of 10 (0, 10, 20, 30, 40, 50, 60).
* **X-Axis:**
* **Categories (from left to right):** Algebra, Counting & Probability, Geometry, Intermediate Algebra, Number Theory, Prealgebra, Precalculus.
* **Legend:** Located in the top-left corner of the chart area.
* **Base Model:** Represented by white bars with a black outline.
* **SFT Model:** Represented by light blue bars.
* **Initial RL Model:** Represented by light pink bars.
### Detailed Analysis
The chart presents the failure ratio for each model within each of the seven math categories. The exact values are annotated on top of each bar.
**1. Algebra:**
* **Base Model (White):** 0.9
* **SFT Model (Light Blue):** 16.5
* **Initial RL Model (Light Pink):** 0.5
* **Trend:** The SFT Model has a significantly higher failure rate than the other two models, which are both very low.
**2. Counting & Probability:**
* **Base Model (White):** 9.9
* **SFT Model (Light Blue):** 41.3
* **Initial RL Model (Light Pink):** 3.8
* **Trend:** A large increase in failure rate for the SFT Model compared to the Base Model. The Initial RL Model shows the best performance (lowest failure).
**3. Geometry:**
* **Base Model (White):** 17.1
* **SFT Model (Light Blue):** 45.1
* **Initial RL Model (Light Pink):** 8.8
* **Trend:** All models show higher failure rates here than in previous categories. The SFT Model's failure rate is more than double that of the Base Model.
**4. Intermediate Algebra:**
* **Base Model (White):** 14.8
* **SFT Model (Light Blue):** 52.9
* **Initial RL Model (Light Pink):** 6.7
* **Trend:** This category contains the highest single failure value on the chart (SFT Model: 52.9). The gap between the SFT Model and the others is most pronounced here.
**5. Number Theory:**
* **Base Model (White):** 6.2
* **SFT Model (Light Blue):** 37.9
* **Initial RL Model (Light Pink):** 1.8
* **Trend:** Similar pattern to Counting & Probability, with the SFT Model failing at a much higher rate. The Initial RL Model performs exceptionally well.
**6. Prealgebra:**
* **Base Model (White):** 2.8
* **SFT Model (Light Blue):** 15.6
* **Initial RL Model (Light Pink):** 0.9
* **Trend:** Relatively lower failure rates across the board compared to more advanced topics. The SFT Model still underperforms the others.
**7. Precalculus:**
* **Base Model (White):** 13.3
* **SFT Model (Light Blue):** 48.4
* **Initial RL Model (Light Pink):** 10.3
* **Trend:** High failure rates for all models, second only to Intermediate Algebra for the SFT Model. The Initial RL Model's failure rate is closest to the Base Model's in this category.
### Key Observations
1. **Consistent Model Hierarchy:** Across all seven categories, the **SFT Model (light blue)** consistently has the highest failure ratio. The **Initial RL Model (light pink)** consistently has the lowest failure ratio. The **Base Model (white)** always falls in between.
2. **Peak Failure Point:** The highest failure ratio recorded is **52.9** for the SFT Model in the **Intermediate Algebra** category.
3. **Category Difficulty:** **Intermediate Algebra** and **Precalculus** appear to be the most challenging categories for the SFT Model, with failure ratios of 52.9 and 48.4, respectively. **Algebra** and **Prealgebra** appear to be the easiest, with SFT Model failure ratios of 16.5 and 15.6.
4. **Performance Gap:** The performance gap (difference in failure ratio) between the SFT Model and the Initial RL Model is largest in **Intermediate Algebra** (52.9 vs. 6.7, a difference of 46.2) and smallest in **Algebra** (16.5 vs. 0.5, a difference of 16.0).
### Interpretation
This chart provides a clear comparative analysis of model performance on the MATH-12k benchmark. The data suggests that **Supervised Fine-Tuning (SFT) alone may lead to a significant increase in problem failure rates** compared to the Base Model across a wide range of mathematical topics. This could indicate issues like overfitting to the training data or a lack of robustness when faced with the test set.
Conversely, the **Initial Reinforcement Learning (RL) Model demonstrates a marked improvement**, achieving the lowest failure ratios in every category. This implies that the RL training phase is highly effective at reducing errors and enhancing the model's problem-solving capabilities beyond both the Base and SFT versions.
The variation across categories indicates that certain mathematical domains (like Intermediate Algebra and Precalculus) are inherently more challenging for these models, or that the training data for these domains may be less effective. The consistent ranking of the models (SFT worst, Initial RL best) across all categories strengthens the conclusion that the training methodology (SFT vs. RL) is a primary factor in performance, rather than the specific subject matter.