TECHNICAL ASSET FINGERPRINT
1cf287ed7c923887c3034a1e
Click to view fullscreen
Press ESC or click to close
FOUND IN PAPERS
EXPERT: healer-alpha-free VERSION 1
RUNTIME: free/openrouter/healer-alpha
INTEL_VERIFIED
\n
## Scatter Plot Matrix: PCA Projections of Token "wrong"
### Overview
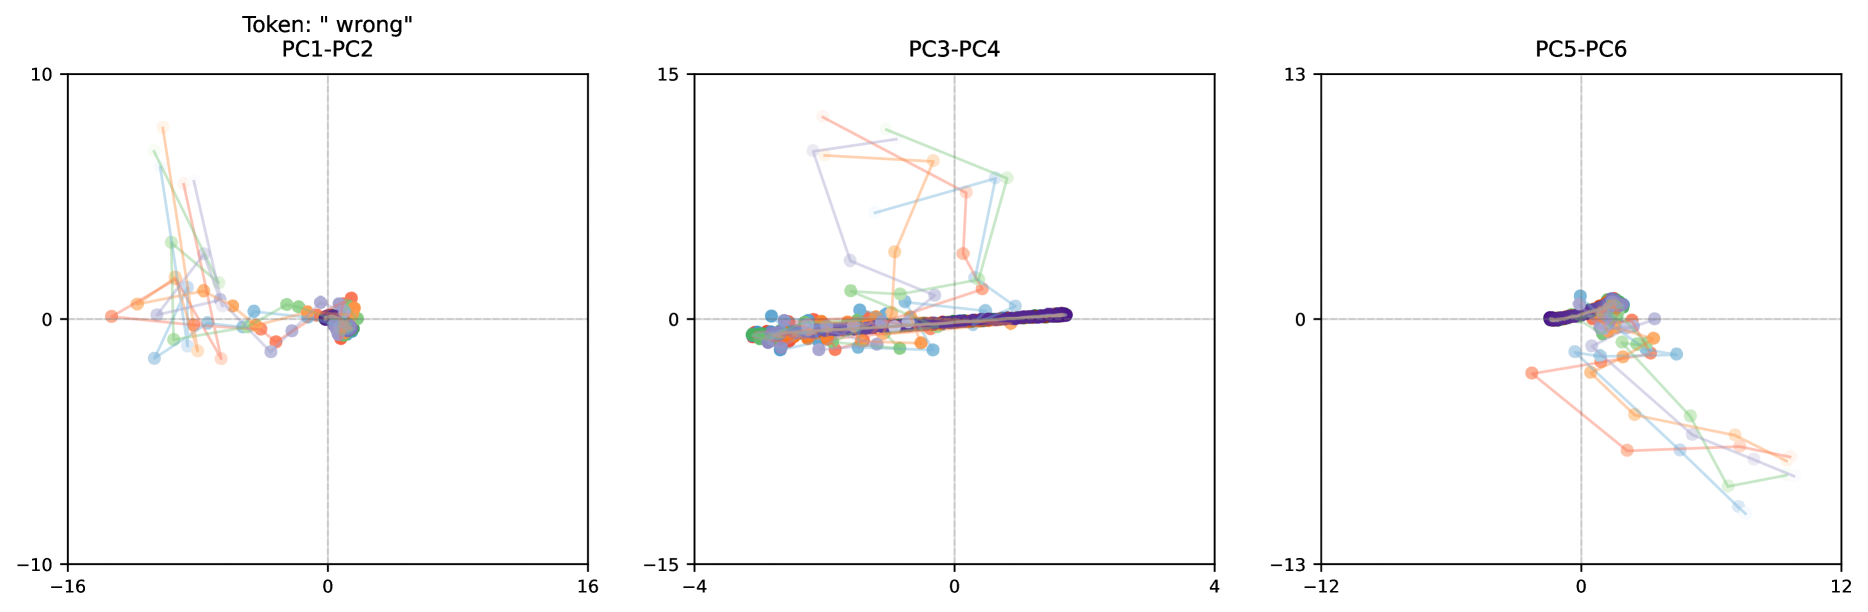
The image displays three horizontally arranged scatter plots, each representing a two-dimensional projection of data onto different pairs of principal components (PCs). The overall title "Token: 'wrong'" suggests the data pertains to the analysis of the embedding or representation of the specific token "wrong" within a model, visualized across its principal component dimensions. Each plot shows multiple colored trajectories (lines connecting points), indicating sequences or variations of this token's representation.
### Components/Axes
* **Overall Title:** "Token: 'wrong'" (positioned above the leftmost plot).
* **Plot 1 (Left):**
* **Title:** "PC1-PC2"
* **X-axis:** Range approximately -16 to 16. Major tick marks at -16, 0, 16.
* **Y-axis:** Range approximately -10 to 10. Major tick marks at -10, 0, 10.
* **Plot 2 (Center):**
* **Title:** "PC3-PC4"
* **X-axis:** Range approximately -4 to 4. Major tick marks at -4, 0, 4.
* **Y-axis:** Range approximately -15 to 15. Major tick marks at -15, 0, 15.
* **Plot 3 (Right):**
* **Title:** "PC5-PC6"
* **X-axis:** Range approximately -12 to 12. Major tick marks at -12, 0, 12.
* **Y-axis:** Range approximately -13 to 13. Major tick marks at -13, 0, 13.
* **Data Series (Colors):** Multiple distinct colors are used for the lines and points (e.g., orange, light blue, green, purple, red). There is **no explicit legend** provided in the image. The colors are consistent across the three plots, implying each color represents a distinct sequence, context, or instance of the token "wrong".
### Detailed Analysis
**PC1-PC2 Plot:**
* **Trend:** Data points and their connecting lines show a dispersed pattern. Several trajectories originate or pass through the central region (near 0,0) and extend outwards, primarily towards the upper-left quadrant (negative PC1, positive PC2) and to a lesser extent the lower-left (negative PC1, negative PC2). A dense cluster of points from multiple colors is visible near the origin (0,0).
* **Key Data Points/Ranges:** The most extreme point reaches approximately (-14, 8) [orange line]. Another notable trajectory (light blue) extends to around (-12, 6). The vertical spread (PC2) is significant, ranging from about -4 to +8.
**PC3-PC4 Plot:**
* **Trend:** This plot shows a very different structure. A dense, horizontal band of points (primarily purple, with others) is tightly clustered along the PC4=0 line, spanning PC3 from about -3 to +3. Above this band, several distinct, loop-like trajectories (orange, light blue, green) extend vertically into the positive PC4 region, reaching up to ~14. These loops show a pattern of moving up and then back down.
* **Key Data Points/Ranges:** The dense horizontal band is concentrated between PC4 ≈ -1 and +1. The highest point is on an orange trajectory at approximately (PC3≈-1, PC4≈14). The vertical range is the largest of the three plots, from about -2 to +14.
**PC5-PC6 Plot:**
* **Trend:** The data exhibits a diagonal trend. The dense cluster near the origin (0,0) is again present. From this cluster, several trajectories (orange, light blue, green) extend diagonally towards the bottom-right quadrant (positive PC5, negative PC6). The lines are more linear and less looped compared to PC3-PC4.
* **Key Data Points/Ranges:** The most extreme point in this direction is on a light blue line at approximately (PC5≈10, PC6≈-10). The spread is primarily along a diagonal axis from top-left to bottom-right.
### Key Observations
1. **Consistent Origin Cluster:** Across all three projection pairs, a dense cluster of points from multiple colors is consistently located near the origin (0,0). This suggests a common or baseline representation for the token "wrong" in the principal component space.
2. **Divergent Trajectories:** From this common origin, different colored sequences diverge in distinct directions specific to each PC pair. This indicates that the variance captured by different principal components separates these sequences.
3. **Component-Specific Structure:** Each PC pair reveals a unique structural pattern:
* PC1-PC2: Dispersed, fan-like spread.
* PC3-PC4: A tight horizontal baseline with dramatic vertical excursions.
* PC5-PC6: A diagonal, linear spread.
4. **Color-Coded Paths:** The use of consistent colors across plots allows tracking of the same sequence's behavior across different dimensional slices. For example, the orange sequence shows high values in PC2 (Plot 1), very high values in PC4 (Plot 2), and moderate positive PC5 with negative PC6 (Plot 3).
### Interpretation
This visualization performs a **Peircean investigative** reading of the token "wrong"'s embedding space. The plots decompose the high-dimensional representation of the token into its most significant axes of variation (Principal Components).
* **What the data suggests:** The token "wrong" does not have a single, fixed representation. Instead, its embedding varies significantly, likely depending on context. The different colored trajectories probably represent the token's representation in different sentences, contexts, or model layers.
* **How elements relate:** The dense origin cluster represents the "core" or average representation. The diverging trajectories show how context pushes the token's meaning in different directions within the latent space. The distinct patterns in each PC pair indicate that different principal components capture different types of semantic or syntactic variation. For instance, the dramatic vertical movement in PC3-PC4 might correspond to a specific, strong contextual feature.
* **Notable anomalies:** The extreme vertical excursions in the PC3-PC4 plot are particularly striking. They suggest that for certain contexts (the orange, light blue, green sequences), the token's representation is pushed very far along the PC4 dimension, which may correspond to a specific, potent attribute (e.g., intensity, negation strength, or a specific type of error).
* **Why it matters:** This analysis moves beyond treating word embeddings as static vectors. It reveals the dynamic, context-dependent nature of meaning within a model. Understanding these trajectories can help diagnose model behavior, interpret how context alters meaning, and potentially identify robust vs. fragile aspects of a token's representation. The clear separation of trajectories in different PC spaces confirms that PCA has successfully identified orthogonal axes of meaningful variation for this token.
DECODING INTELLIGENCE...