\n
## Scatter Plot: Confidence vs. Target Length (Jurisprudence)
### Overview
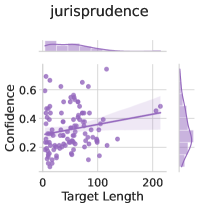
This image presents a scatter plot visualizing the relationship between "Target Length" and "Confidence" for the category "jurisprudence". A regression line with a shaded confidence interval is overlaid on the scatter points. There are also two marginal distributions displayed at the top and right of the main plot.
### Components/Axes
* **Title:** jurisprudence (top-center)
* **X-axis:** Target Length (bottom-center), ranging from approximately 0 to 220.
* **Y-axis:** Confidence (left-center), ranging from approximately 0.15 to 0.65.
* **Scatter Points:** Purple dots representing individual data points.
* **Regression Line:** A purple line representing the trend of the data.
* **Confidence Interval:** A light purple shaded area around the regression line, indicating the uncertainty in the estimated trend.
* **Top Marginal Distribution:** A density plot showing the distribution of "Target Length".
* **Right Marginal Distribution:** A density plot showing the distribution of "Confidence".
### Detailed Analysis
The scatter plot shows a generally positive, but weak, correlation between Target Length and Confidence.
* **Regression Line Trend:** The regression line slopes upward, indicating that as Target Length increases, Confidence tends to increase. However, the slope is relatively shallow.
* **Scatter Point Distribution:** The points are widely scattered, indicating a significant amount of variability in Confidence for a given Target Length.
* **Data Points (Approximate):**
* At Target Length = 0, Confidence ranges from approximately 0.18 to 0.5.
* At Target Length = 50, Confidence ranges from approximately 0.2 to 0.55.
* At Target Length = 100, Confidence ranges from approximately 0.25 to 0.6.
* At Target Length = 150, Confidence ranges from approximately 0.3 to 0.55.
* At Target Length = 200, Confidence ranges from approximately 0.35 to 0.6.
* **Top Marginal Distribution:** The distribution of Target Length appears to be somewhat skewed to the right, with a peak around a Target Length of approximately 50-75.
* **Right Marginal Distribution:** The distribution of Confidence is skewed to the left, with a peak around a Confidence of approximately 0.3.
### Key Observations
* The correlation between Target Length and Confidence is weak. The regression line has a shallow slope, and the scatter points are widely dispersed.
* There is a considerable amount of variability in Confidence, even for similar Target Lengths.
* The marginal distributions suggest that shorter Target Lengths and lower Confidence values are more common.
### Interpretation
The data suggests that, for the category "jurisprudence", there is a slight tendency for Confidence to increase with Target Length. However, this relationship is not strong, and other factors likely play a significant role in determining Confidence. The weak correlation could indicate that the model's confidence is not strongly dependent on the length of the target text in this domain. The marginal distributions provide additional context, showing the typical ranges of Target Length and Confidence values. The skewness in the distributions suggests that shorter Target Lengths and lower Confidence values are more prevalent. The wide spread of the data points indicates that the model's performance is inconsistent, and there is significant room for improvement. The confidence interval around the regression line highlights the uncertainty in the estimated trend, further emphasizing the weak correlation.